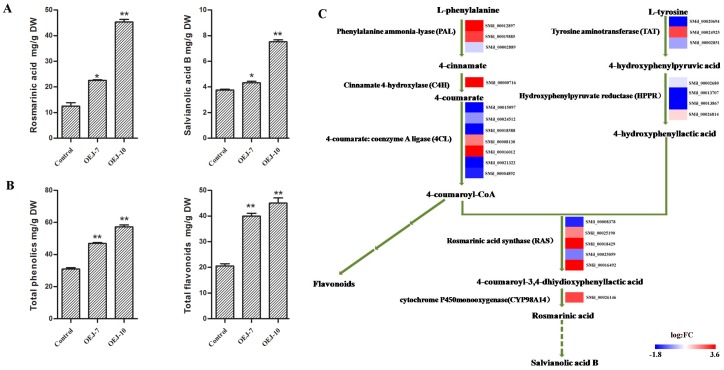
Figure 3.
(A) Concentrations of rosmarinic acid (RA) and salvianolic acid (Sal B) in root extracts from control and transgenic OEJ-7 and OEJ-10 plants. All data are means of three replicates, with error bars indicating SD. ** Values are significantly different from the control at p < 0.01. (B) Concentrations of total phenolics and total flavonoids in root extracts from control and transgenic OEJ-7 and OEJ-10 plants. All data are means of three replicates, with error bars indicating SD. * and ** Values are significantly different from the control at p < 0.05 and p < 0.01, respectively. (C) Differentially expressed genes (DEGs) involved in the pathway for salvianolic acid biosynthesis between OEJ-10 and the control. For each gene, relative expression (OEJ-10 versus control) is represented as log2FC. The color scale is shown at the bottom. Higher expression levels are shown in red.

