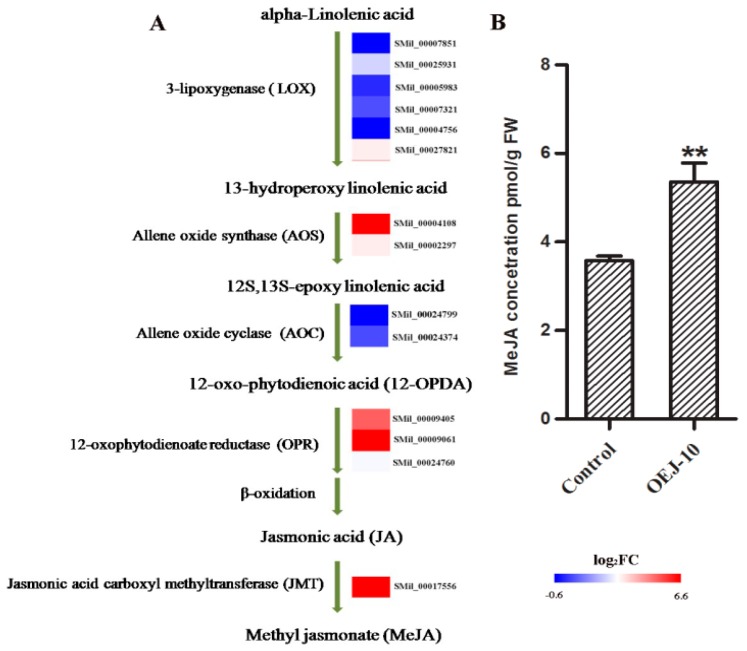
Figure 7.
(A) DEGs involved in the pathway for MeJA biosynthesis between OEJ-10 and the control. For each gene, relative expression (OEJ-10 versus control) is represented as log2FC. The color scale is shown at the bottom. Higher expression levels are shown in red. (B) Concentrations of MeJA in leaf extracts from transgenic line OEJ-10 and the control. All data are means of three replicates, with error bars indicating SD. ** Values are significantly different from the control at p < 0.01.

