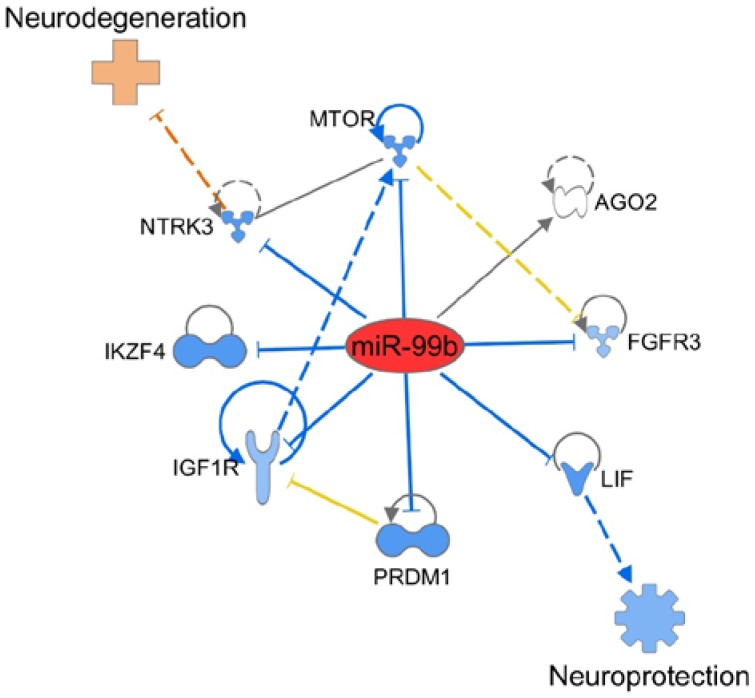
Figure 6.
IPA-based schematic representation of the mediators and pathways affected by miR-99b, leading to neuroprotection versus neurodegeneration depending on the direction of change. The description of lines, arrows, color, etc. is same as in the legend to Figure 5.

