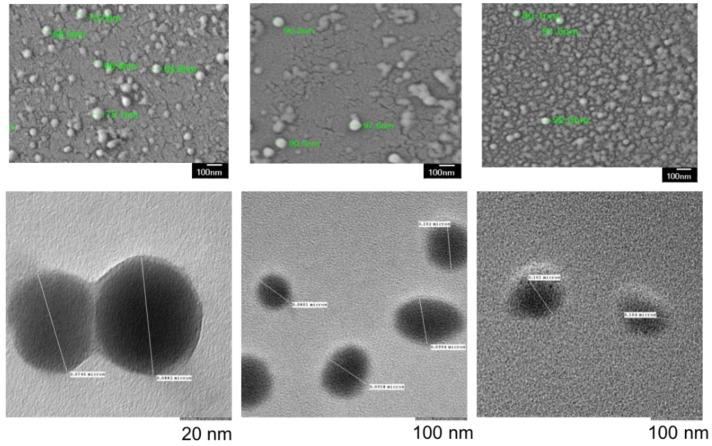
Figure 2.
SEM (top) and TEM (bottom) images of EMPTY mPEG-PLGA (left), BPD (middle) and CED (right) NPs show uniform size distribution and spherical morphology. Empty NPs were slightly smaller than drug loaded NPs. Size measurements complemented DLS results. Small differences in size compared to DLS were attributed to dehydration of NPs during preparation for SEM and TEM. Scale bar: 100 nm.

