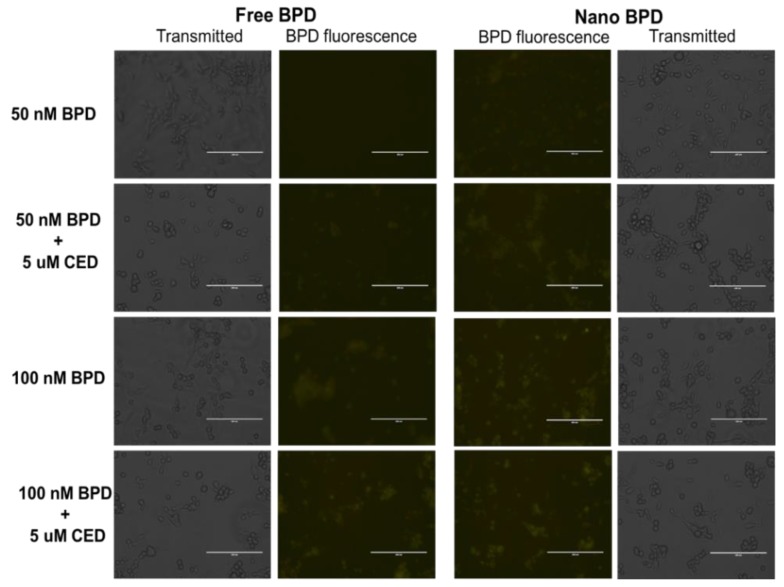
Figure 6.
Imaging Study results for free (left side) versus NP (right side) formulations of BPD using various concentrations of 50 and 100 nM BPD to assess fluorescence in U87 cells. Cells were also treated with CED in certain treatment groups to assess the influence of CED on BPD fluorescence. Images were taken at 20× magnification at 60% light intensity (Cy5 filter) for each image shown above. An increase in fluorescence is seen in the NP BPD form compared to the free drug, while the incidence of CED does not appear to inhibit BPD fluorescence. Scale Bar: 200 µm.

