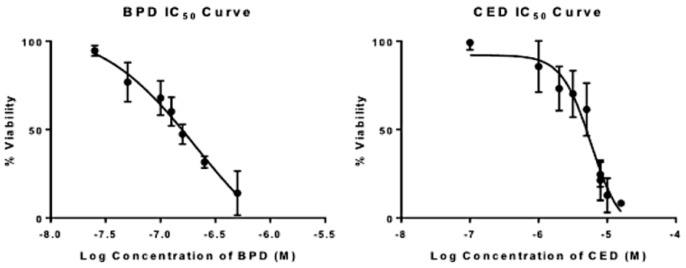
Figure 7.
Effect of BPD and CED on U87 cellular survival as shown by IC50 results of free drugs BPD (left) and CED (right). GraphPad Prism log (inhibitor) vs response-variable slope (four parameters) non-linear regression analysis was used for n = 3 trials. The equation of the line is given as Y = Bottom + (Top-Bottom)/(1 + 10^((LogIC50 − X)*HillSlope)) based on GraphPad Prism analysis. Top and bottom refer to plateaus 100 and 0, respectively, on the y-scale for % Viability.

