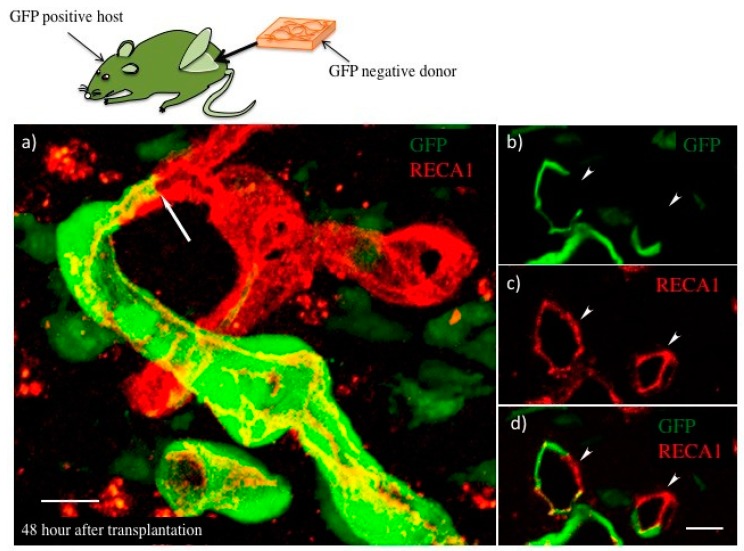
Figure 4.
Donor myocardial cell sheets transplanted into GFP+ host rats. (a) Host–donor vasculature connecting point shown by confocal microscopy. Green indicates GFP+ cells, and red indicates RECA-1+ ECs. Arrow indicates host–donor EC connecting border. (b–d) show the section of connecting points. (b) GFP+ host originated vascular image and (c) RECA-1+ total vascular image. (d) A merged image of (b) and (c). Arrow-heads indicate GFP-vasculature originating from donor. Scale bar: (a,d), about 10 µm. The scale bar was added with estimation from original data.

