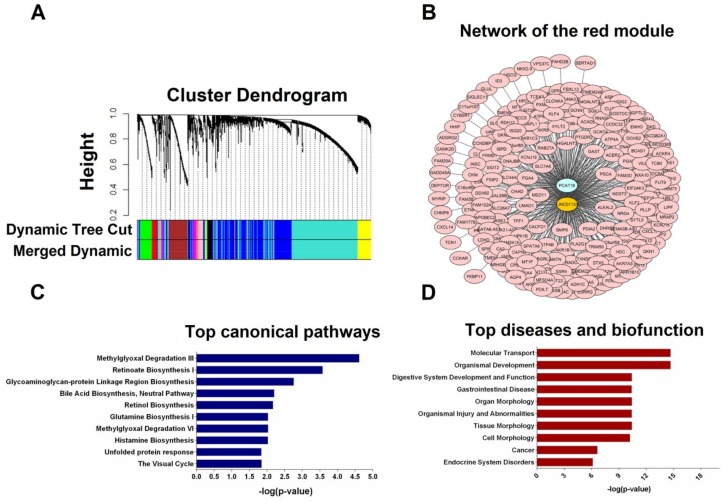
Figure 5.
Weighted gene correlation network analysis (WGCNA) and pathway analysis using RNA-sequencing (RNA-seq) data from the TCGA stomach cancer dataset. (A) WGCNA cluster dendrogram of differentially expressed mRNAs and lncRNAs. Each leaf (vertical line) in the dendrogram corresponds to a gene. The color row underneath the dendrogram shows the assigned original module and the merged module. The lncRNA candidates PCAT18 and LINC01133 were clustered in the red module; (B) The lncRNA-mRNA network of the red module visualized using the cytoscape software platform; (C) Over-represented terms in the Molecular and Cellular Function category; (D) Top diseases and biofunctions related to co-expressed genes.

