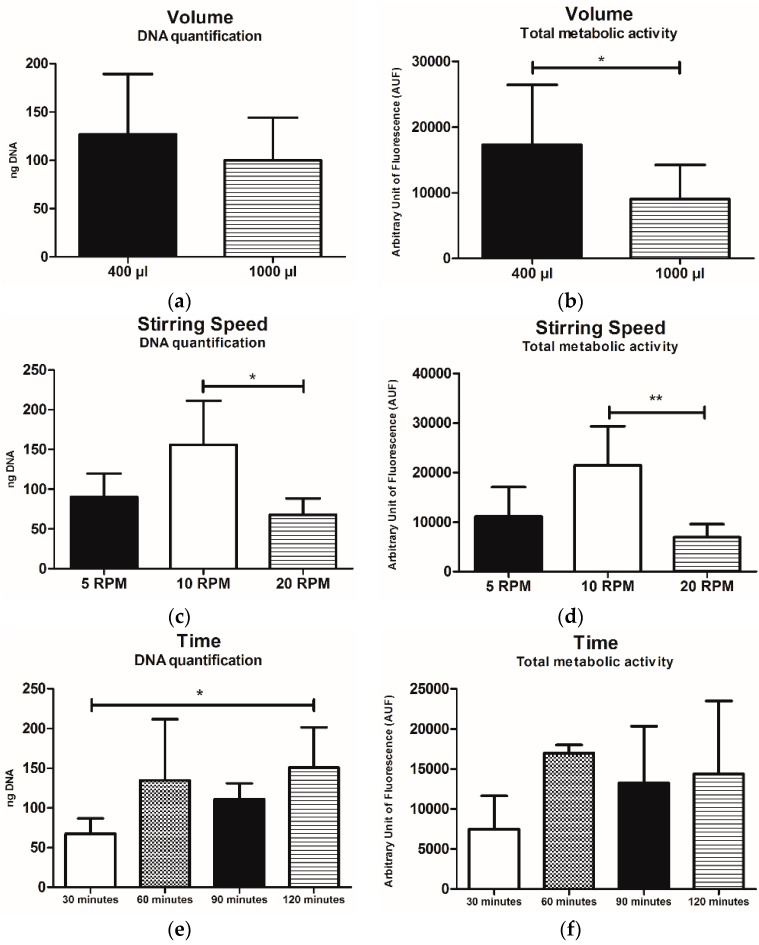
Figure 5.
(a,c,e) represent the DNA content while (b,d,f) represent the total metabolic activity of samples cultured with intermittent dynamic protocols (1–6), grouped for volume LFAMs/cells suspension (µL) (a,b), stirring speed (RPM) (c,d) and time of the process (min) (e,f). Data are expressed as mean values ± SD. * p < 0.05, ** p < 0.01.

