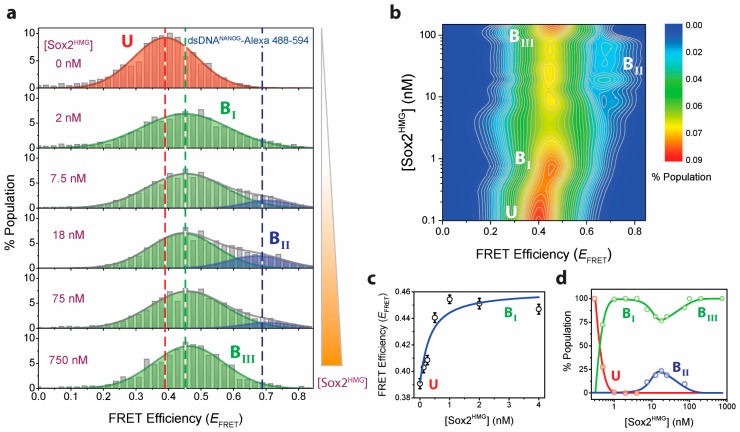
Figure 2.
smFRET reveals Sox2HMG concentration-dependent multistep bending of DNANANOG. (a) EFRET histograms of DNANANOG with increasing [Sox2HMG]. (b) [Sox2HMG]-EFRET contour map color coded based on fractional occupancy of individual DNA conformations. Corresponding DNA conformations are marked on the contour map. (c) Sox2 binding isotherm of the U ⇋ BI transition as probed by detecting changes in EFRET, linked to dsDNA bending transition. The NLS-derived apparent KD for this binding step is 0.30 (±0.04) nM (binding equation with fixed Hill coefficient of 1). (d) dsDNANANOG conformational distributions as modulated by Sox2HMG concentration, determined from NLS fitting of individual smFRET histograms to Gaussian functions.

