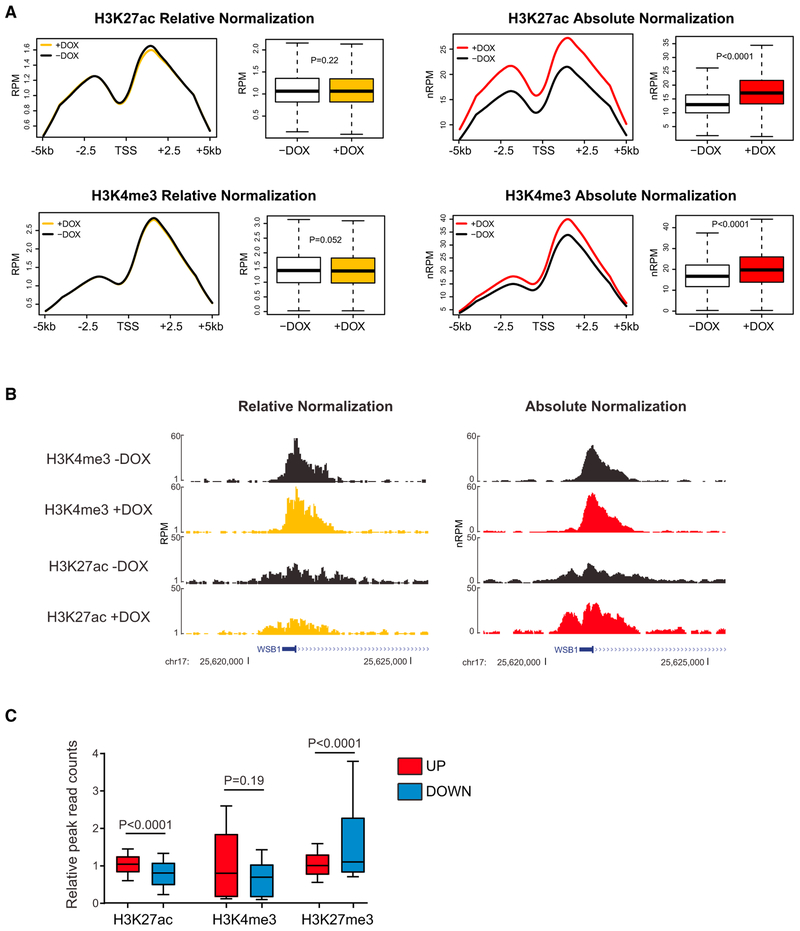
Figure 4. Absolute per Cell-Normalized Chromatin Immunoprecipitation Reveals Global Effects of HMGN1 Overexpression on Histone Marks.
(A) Metagene plots and read quantitation of H3K27ac and H3K4me3 ChIP-seq in Nalm6 cells stably expressing a doxycycline-inducible HMGN1 cDNA 6 hours after addition of doxycycline or vehicle to the culture medium. Plots on the left are relative median read count-normalized “traditional” ChIP-seq, and on the right, absolute per cell-normalized to sequencing reads from ChIP-seq of exogenous spiked-in Drosophila S2 cell nuclei. RPM, reads per million; nRPM, normalized reads per million; x axis of metagene plots shows the transcriptional start site (TSS) and 5 kb upstream and downstream. Boxplots represent the distribution of ChIP-seq peak height at each detected gene (compared by t test).
(B) Gene tracks showing a representative locus on chr17 where an increase in H3K27 acetylation after addition ofdoxycycline is only evident after applying per cell absolute spike-in normalization.
(C) Relative read counts of histone marks at peaks within 1 kb of the TSS of genes that significantly (fold-change >1.5, p < 0.05) increased (UP, red) or decreased (DOWN, blue) in expression after induction of HMGN1 overexpression. Distributions compared by t test.

