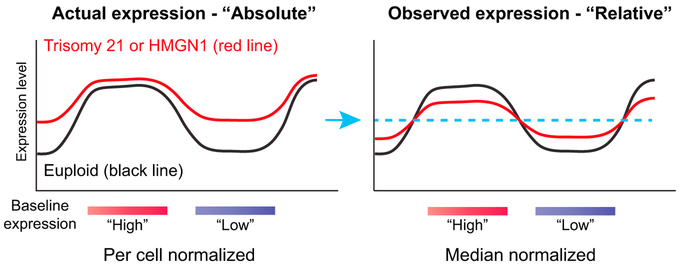
Figure 6. Model for Gene Expression Changes Associated with Trisomy 21 or HMGN1 Overexpression.
Absolute per cell normalization of transcriptome data may provide a mechanistic explanation for some previous, incompletely explained observations in trisomy 21 cells, including and global RNA and epigenomic changes. If the actual expression pattern in trisomy 21 (or with HMGN1 overexpression) is amplification that differentially affects areas of baseline “high” or “low” expression (left), then forced normalization to an equivalent median signal between samples (blue arrow and dotted line) would instead be interpreted as decreased expression in baseline “high” expressed genes and increased expression in “low” expressed genes (right).

