Fig. 2.

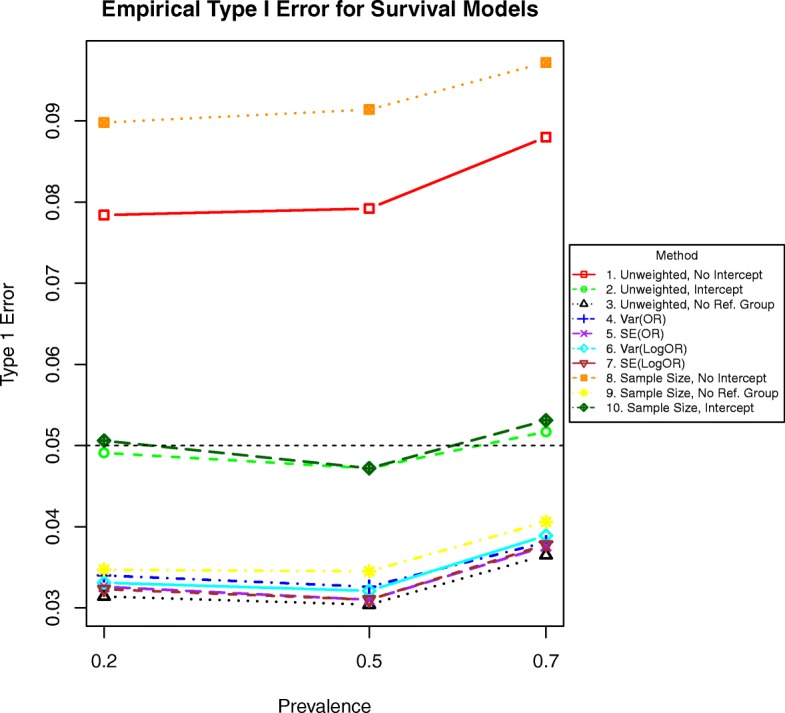
Simulated type I error rates for each method by increasing prevalence with time-to-event outcomes, or equivalently, decreasing censoring. The dashed horizontal line at 0.05 indicates the significance level

Simulated type I error rates for each method by increasing prevalence with time-to-event outcomes, or equivalently, decreasing censoring. The dashed horizontal line at 0.05 indicates the significance level