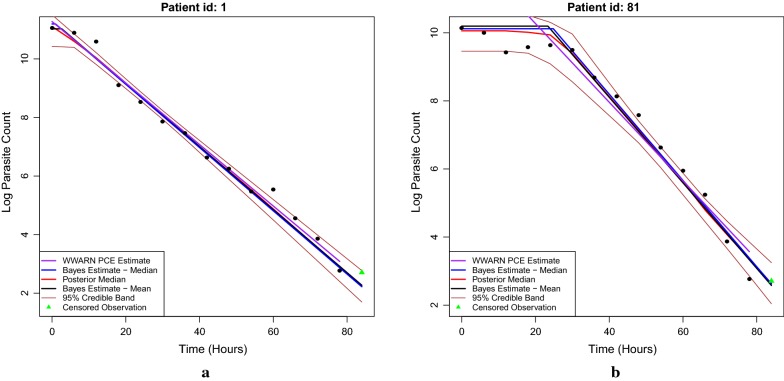
Fig. 6.
a The posterior log-parasitaemia profile of patient 1. The profile of patient 1 is identified as only having a decay phase. The brown lines characterize the point-wise 95% credible intervals of the posterior samples. The solid black and blue lines represent, respectively, the posterior mean and median clearance rates from the Bayesian procedure. The solid red line is the posterior median curve and the purple line is the fit given by the WWARN PCE method. The triangles are censored observations due to the detection limit. b The posterior log-parasitaemia profile of patient 81. The profile of patient 81 is identified as having a significant lag phase before the decay occurs. The solid black and blue lines (in the decay phase) represent the posterior mean and median clearance rates from the Bayesian procedure, respectively. The solid red line is the posterior median curve and the purple line is the fit given by the WWARN PCE method. The green triangles are censored observations due to the detection limit

