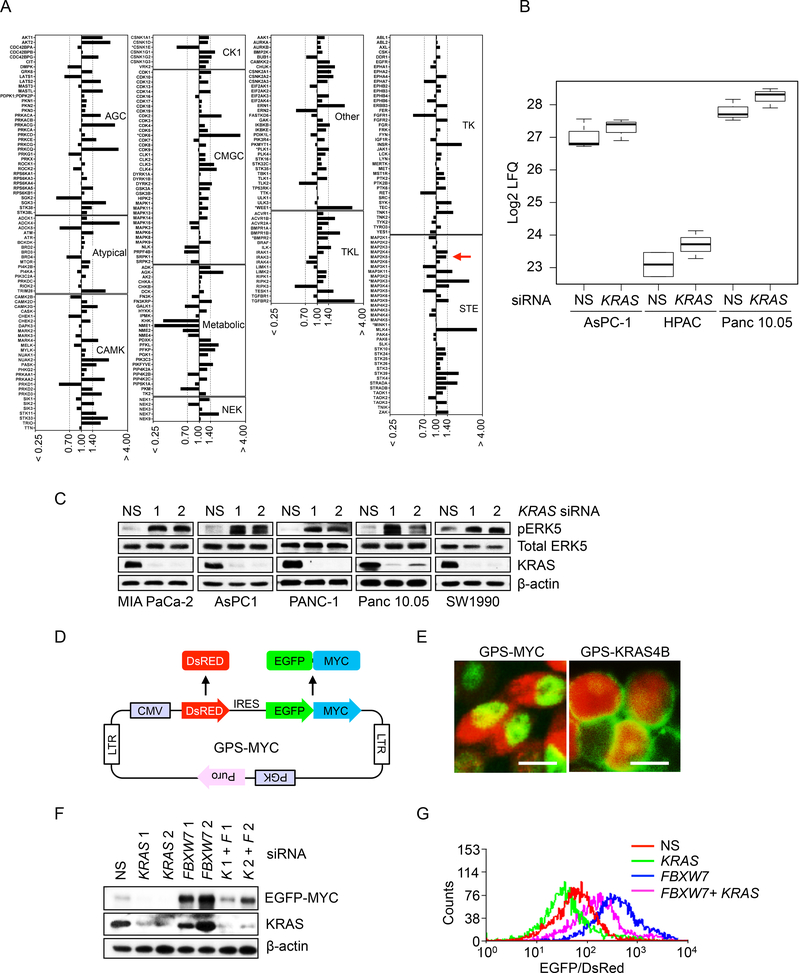
Figure 5. Kinase Activation and MYC Protein Degradation Assays Identify a Role for MEK5-ERK5 Signaling in KRAS Regulation of MYC Protein Degradation.
(A) MIB/MS whole-kinome profiling upon transient siRNA KRAS knockdown in PDAC cells. Cell lysates were prepared from Panc 10.05 cells transfected with NS or KRAS 1 siRNA 1 for 24 hr, then subjected to affinity capture of endogenous kinases, followed by quantitative mass spectrometry. The kinase abundance ratios (KRAS siRNA/NS), as determined by label-free quantitative (LFQ) analysis, were averaged from three independent experiments. A ratio ≤ 0.7 denotes decreased MIB binding while a ratio ≥ 1.4 denotes increased MIB binding.
(B) Boxplots of MIB/MS analysis data (log2 LFQ) for MEK5 dynamics upon KRAS knockdown. The upper line of the box is the 75th percentile of MEK5 log2 LFQ, the middle line is the 50th percentile, and the bottom line is the 25th percentile. Upper and lower lines outside of the box represent the distance to the point closest to but not greater than 1.5 times the interquartile range (75th – 25th percentile difference) in each direction. PDAC cells were treated as described in panel 5A. Data shown for each condition represents three biological replicates.
(C) PDAC cell lines were transfected with NS or two independent KRAS siRNAs (24 hr). Cell lysates were blotted as indicated.
(D) A schematic illustration of the pGPS-LP lentivirus vector encoding MYC (GPSMYC). GPS-MYC contains a single CMV promoter and an IRES that permits the cotranslation of DsRed and chimeric EGFP-MYC from a single RNA transcript at a fixed ratio.
(E) Immunofluorescent images of MIA PaCa-2 cells expressing GPS-MYC (left) or GPSKRAS4B (right). Scale bar = 10 μm.
(F) MIA PaCa-2 cells stably expressing the GPS-MYC reporter were transfected with NS or FBXW7 siRNA for 24 hr, followed by transfection with NS or KRAS siRNA for an additional 24 hr. Immunoblotting was done as indicated. The EGFP-MYC fusion was detected with MYC antibody.
(G) Histogram of EGFP/DsRed ratio measured by flow-cytometry. MIA PaCa-2 cells stably expressing the GPS-MYC reporter were treated as in (F), then EGFP and DsRed fluorescence were measured by FACS. Data were plotted using Summit 5.2.
See also Figure S5.

