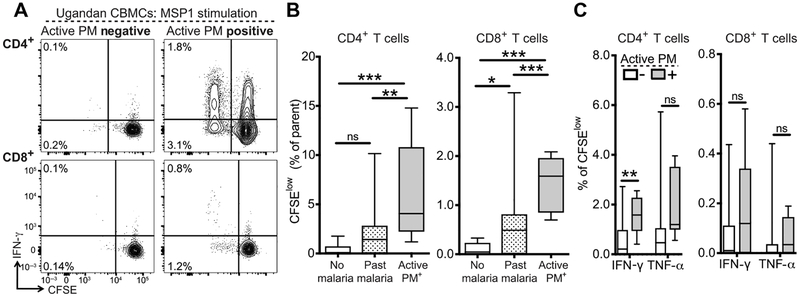
Fig. 4. Proliferation of cord blood CD4+ and CD8+ T cells in response to MSP1 peptide stimulation.
(A) Representative CFSE dilution profiles for CD4+ (upper) and CD8+ (lower) T cells stimulated with MSP1 peptide pools for 6 days and restimulated with PMA/ionomycin. Gated on live CD14−CD19−γδTCR−CD3+ T cells. Values indicate frequency of CFSElow T cells as % CD4+ or CD8+ T cells. (B) Frequency of CFSElow CD4+ (left) or CD8+ (right) T cells in infants born to mothers without malaria during pregnancy (white bar; n = 4), with past malaria infection (striped bar; n = 38), or with active PM (gray bar; n = 9). (C) Quantification of CFSElow cytokine-producing CD4+ and CD8+ T cells stratified by infant malaria exposure (PM−, white bars, n = 41; PM+, gray bars, n = 8). For all experiments, values are calculated by background subtraction of dimethyl sulfoxide-stimulated and medium-alone controls. *P < 0.05, **P < 0.01, ***P < 0.001, Kruskal-Wallis and Wilcoxon rank sum test.

