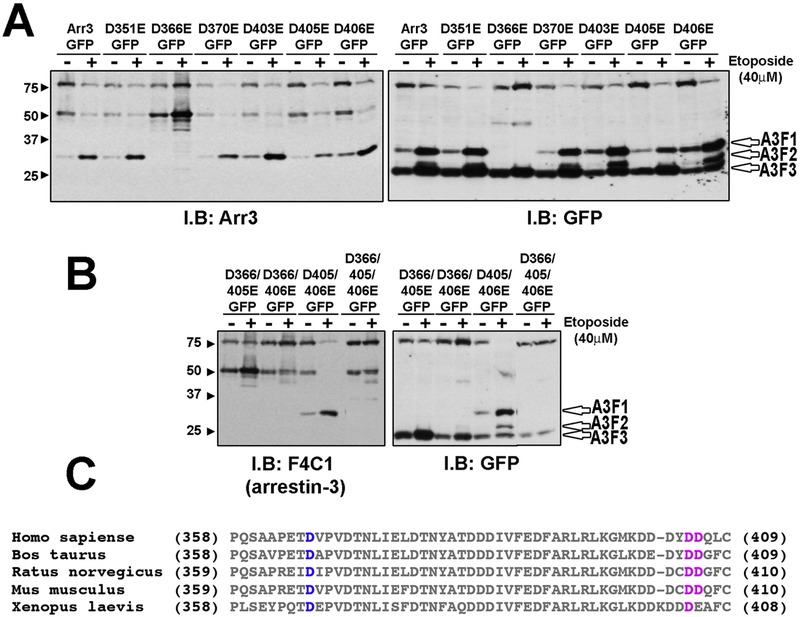
Fig. 2. Identification of cleavage sites within arrestin-3.
(A) Rat-1 cells were transfected with indicated arrestin-3-GFP mutants. Apoptosis was induced by 18 h treatment with 40 μM etoposide. The cell lysate was analyzed using arrestin-3 or GFP antibodies. GFP antibody detected three different cleavage products, A3F1, A3F2 and A3F3 (open arrowheads). Arrestin3 antibody detected only the A3F1 product. Mutant D336E showed a loss of cleavage products A3F1 and A3F2. (B) Double and triple mutants were treated similarly. Cleavage of double mutant D405/406E yielded A3F1 band. Arrestin-3-D366/405/406E (3xE) showed a significant loss of caspase cleavage. Representative blots from three experiments that yielded virtually identical results are shown in A and B. (C) Sequence alignment of arrestin-3 C-terminal regions. Conserved D366 is highlighted in blue. D406/D406 (highlighted in pink) are conserved in mammals but only one of these two residues is conserved in Xenopus.

