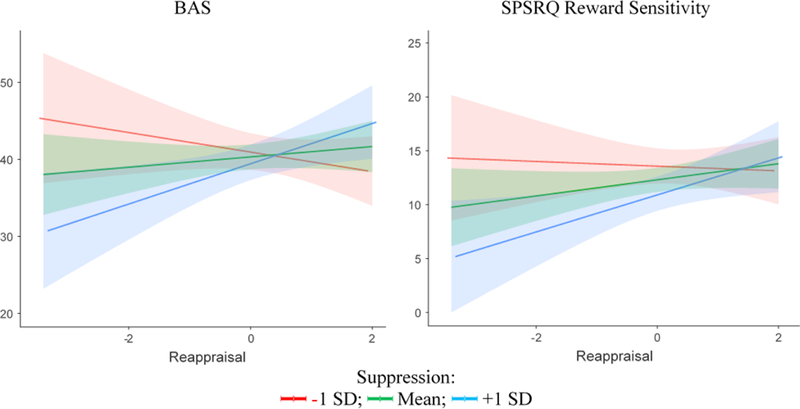
Figure 1.

Simple slopes reflecting reappraisal-BAS relationships (A) and reappraisal-SPSRQ Reward Responsivity relationships (B) at 1 SD below the mean (red), at the mean (green), and 1 SD above the mean (blue) suppression score. Note: Shaded regions reflect 95% C.I. around simple slopes.
