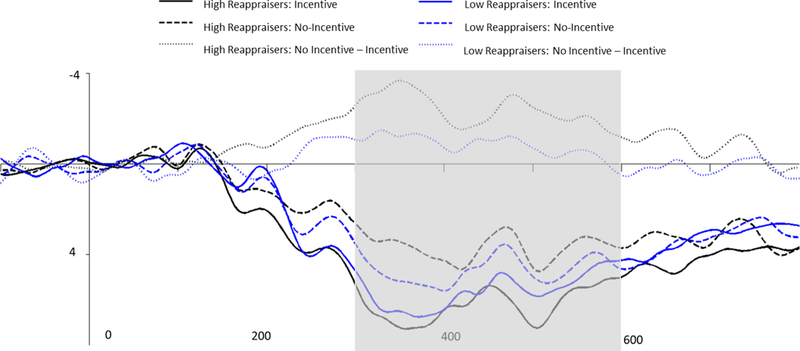
Figure 2.

ERP waveforms depicting the cue P300 for incentive (noted with solid lines) and no-incentive cued trials (noted with dashed lines), as well as the difference score between incentive and no-incentive trials measured in microvolts (μV) at Pz. ERP waveforms and differences scores are depicted separately for high reappraisers (noted in black) and low reappraisers (noted in blue). Note: The time window used to measure the cue P300 is indicated in gray. Participants were classified as high or low reappraisers based upon a median split.
