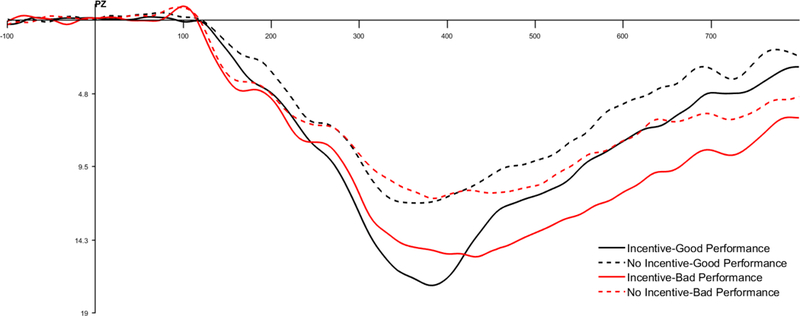
Figure 7.

ERP waveforms depicting the Feedback-P300 for incentive (noted with solid lines) and no-incentive cued trials (noted with dashed lines) measured in microvolts (μV) at Pz. ERP waveforms and differences scores are depicted separately for good performance (noted in black) and bad performance (noted in red). Note: We quantified the Feedback-P300 was defined as the mean amplitude between 250 and 450 ms at Pz.
