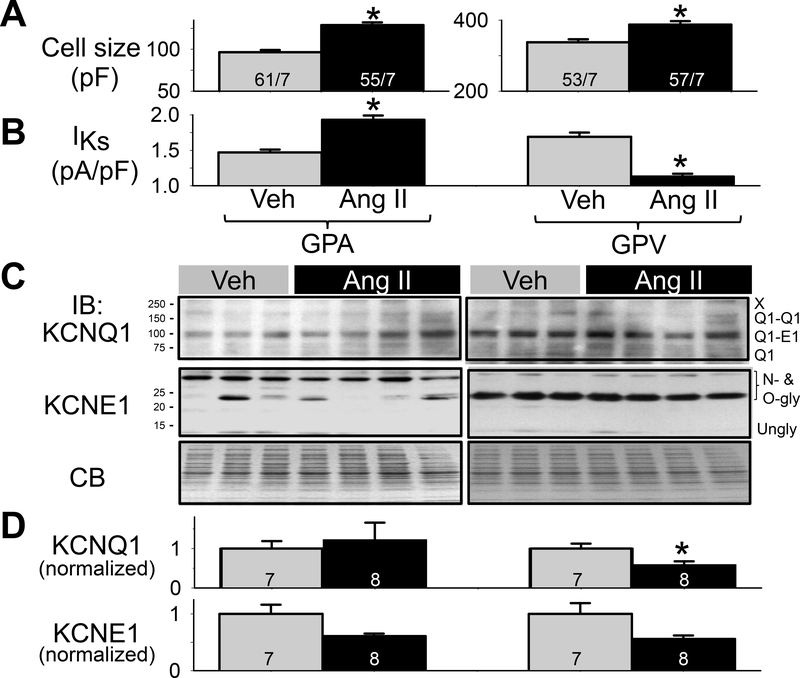
Fig. 3. Effects of chronic Ang II administration on KCNQ1 and KCNE1 protein levels in guinea pig atria and ventricles.
(A) Cell size measured by cell capacitance in the 4 groups of myocytes. n/M: number of myocytes examined/number of animals. (B) lKs current densities from the 4 groups of myocytes (same as Fig. 2B). (C) Immunoblot images of whole tissue lysates (50 ug/lane) prepared from atria and left ventricles of 3 Veh and 4 Ang ll animals. CB: Coomassie-blue stain of gel as loading control. Size marker bands (in kDa) noted on left. Bands of interest and their nature noted on right. (D) Summary of densitometry. The intensities of bands of interest were combined, and normalized by the mean value of Veh lanes from the same membrane. Number of animals noted in histogram bars. One-way ANOVA, p < 0.01, followed by pair-wise test, * p < 0.05, Ang ll vs Veh in KCNQ1 protein level.

