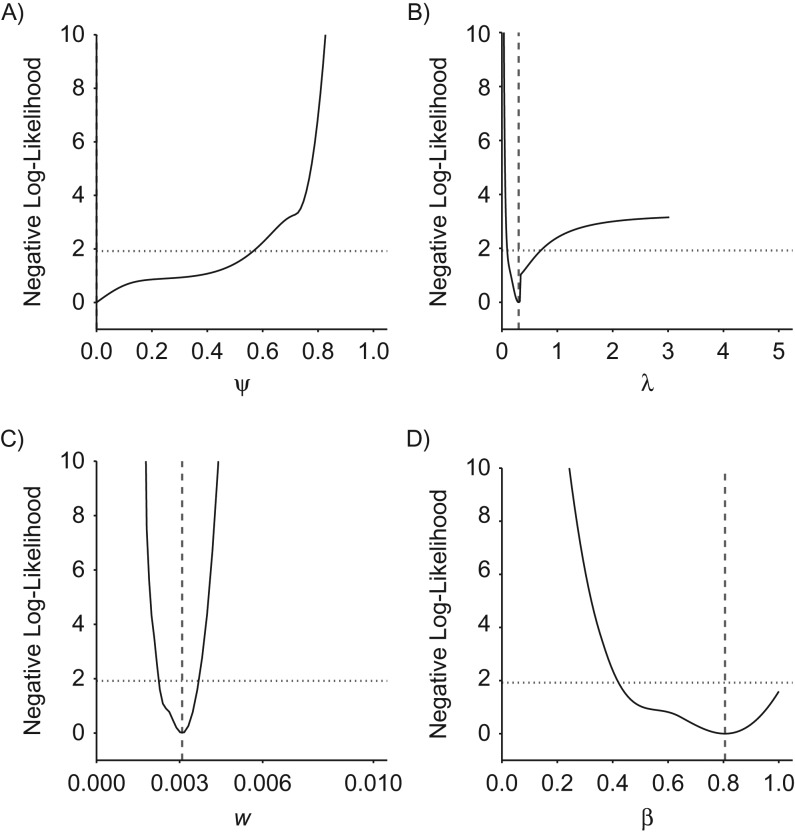
Figure 7.
Profile likelihood for the parameters of a mixture model in an analysis of grouped data from Canadian National Breast Screening Study 2 (CNBSS-2), 1980–1985. The graph shows the relative negative log-likelihoods for the natural history parameters ψ (A), λ (B), w (C), and β (D) based on fitting of the mixture model to CNBSS-2 data (see also Web Table 1). Vertical dashed lines correspond to maximum likelihood estimates. The intersection of the relative negative log-likelihood with the horizontal dotted line indicates the 95% profile confidence interval.

