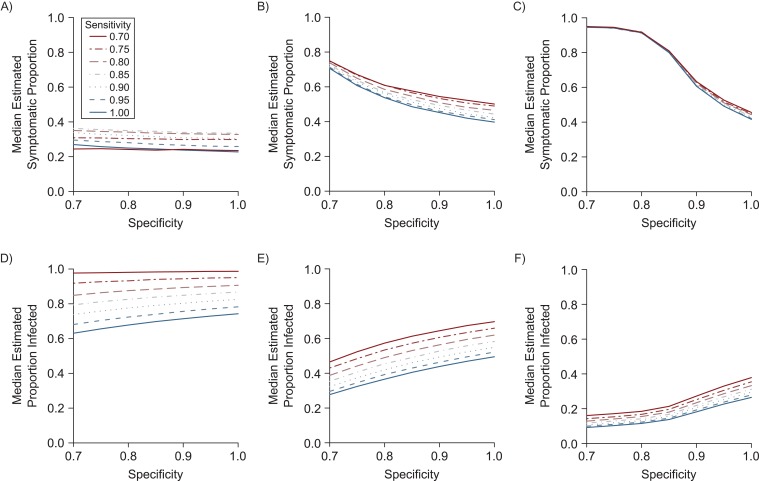
Figure 1.
Simulation showing the effect of sensitivity and specificity on estimates of the symptomatic proportion and Zika virus (ZIKV) infection prevalence in Yap (2007), French Polynesia (2013–2014), and Puerto Rico (2016). The top row shows the effect of different values of sensitivity (line style) and specificity (x-axis) on point estimates of the median proportion of ZIKV infections that were symptomatic in studies in Yap (A), French Polynesia (B), and Puerto Rico (C). The bottom row shows the corresponding estimates of infection prevalence for the study populations in Yap (D), French Polynesia (E), and Puerto Rico (F). In each of these simulations, we assumed that symptoms caused by ZIKV and other illnesses could overlap .

