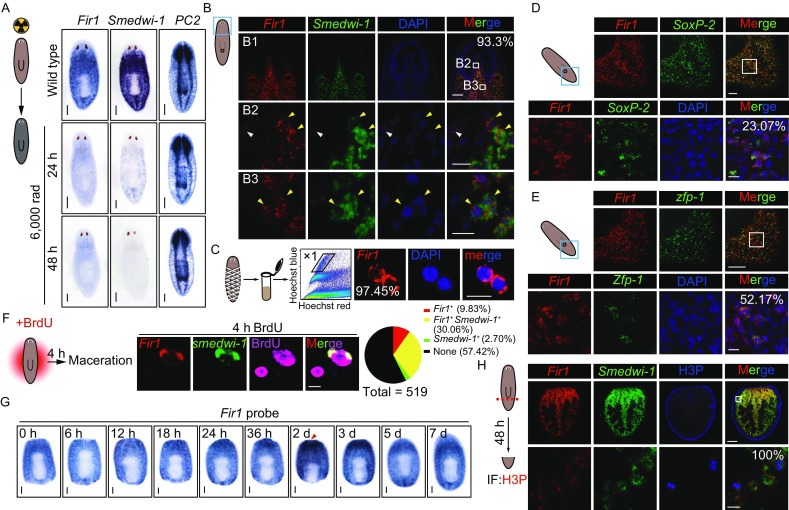
Figure 3.

Fir1 mRNA is mainly expressed in neoblasts. (A) Colorimetric WISH of animals after 6,000 rads irradiation exposure showing that Fir1 mRNA levels were irradiation sensitive. For each condition, n = 10 animals. Scale bars, 200 μm. (B) Representative confocal projections (ten 1 μm z-stacks) of planarian head, stained with Fir1 (red), smedwi-1 (green) and DAPI (blue). (B1) Head of the planarian. (B2) Zoom-in in the brain region. (B3) Zoom-in post brain. White arrowheads highlight Fir1+smedwi-1− cells; yellow arrowheads point at double positive cells. The number indicates the percentage of Fir1+ cells co-expressing smedwi-1 (n > 500 cells). Ventral views, anterior up. Scale bars, B1: 100 μm; B2, B3: 10 μm. (C) Fir1 expression in neoblasts (referred to as X1 cells) sorted using FACS was detected using FISH. The number indicates the percentage of X1 cells expressing Fir1 (n > 400 cells). Scale bar, 10 μm. (D) Double FISH of Fir1 (red) and soxP-2 (green) with DAPI (blue). Box indicates zoomed-in region. Ventral view of planarian tail. The number indicates the percentage of Fir1+ cells co-expressing soxP-2 (n > 500 cells). Scale bar, upper panel: 50 μm; lower panel: 10 μm. (E) Double FISH of Fir1 (red) and zfp-1 (green) with DAPI (blue). Box indicates zoomed-in region. Ventral view of planarian tail. The number indicates the percentage of Fir1+ cells co-expressing zfp-1 (n > 500 cells). Scale bar, upper panel: 50 μm; lower panel: 10 μm. (F) Representative confocal plane from macerated planarians subjected to a 4 h BrdU pulse and labeled by Fir1 and smedwi-1 FISH probes and BrdU IF. Pie chart quantifies the percentage of BrdU+ cells labeled with Fir1 and smedwi-1 FISH probes (n = 519). Scale bar, 5μm. (G) Colorimetric WISH of regenerating middle pieces for Fir1. Ventral views, for each time point, n = 10 animals. Scale bars, 200 μm. (H) Representative confocal projections of tail pieces 48 h following amputation, labelled by Fir1 (red), smedwi-1 (green) and H3P antibody (blue). Box indicates zoomed-in region. The number indicates the percentage of H3P+ cells co-expressing Fir1 (n > 100 cells). Scale bars, upper panel: 100 μm; lower panel: 10 μm
