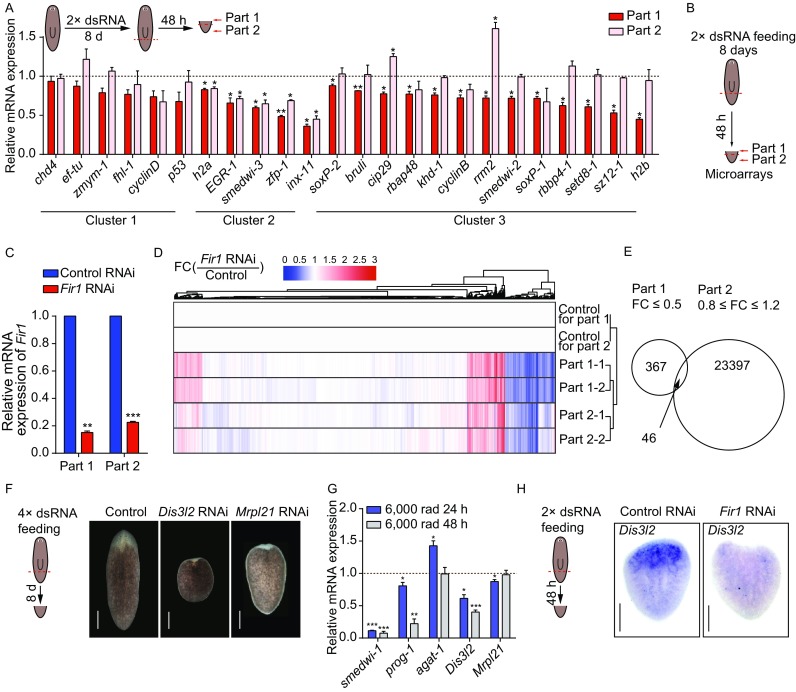
Figure 4.

Analysis of Fir1 downstream genes. (A) qRT-PCR showing the relative mRNA expression of several known neoblast regulators following Fir1(RNAi). Shown are averages of three independent experiments; error bars = SEM; ** equals P < 0.001; *** equals P < 0.0001; significance determined with Student’s t test. (B) Schematic of strategy for expression profiling. (C) qRT-PCR showing that relative expression level of Fir1 decreased dramatically in part 1 and part 2 regions of Fir1(RNAi) tail pieces. Shown are averages of three independent experiments; error bars = SEM; ** equals P < 0.001; *** equals P < 0.0001; significance determined with Student’s t test. (D) Heat map of microarrays. Fold change (Fir1 RNAi/control); (red) up, (blue) down; P < 0.05. (E) Venn diagram of genes down-regulated in the part 1 region and invariable in the part 2 region in Fir1(RNAi) tail piece. (F) RNAi knockdown of two candidates (Dis3l2 and Mrpl21) respectively, tail pieces hardly regenerate blastemas (n = 6). To increase the RNAi efficiency, we chose 4× dsRNA feedings for the two genes. The animals were amputated behind the pharynx at the day after the fourth dsRNA feeding, and the tail pieces were imaged 8 days post-amputation. Scale bars, 200 μm. (G) Relative expression levels of smedwi-1, prog-1, agat-1, Dis3l2 and Mrpl21 mRNA in animals after 6,000 rads irradiation exposure. Error bars represent SEM; Student’s t test: * equals P < 0.05, ** equals P < 0.001, *** equals P < 0.0001. (H) Colorimetric WISH of Fir1(RNAi) tail pieces 48 h post-amputation for Dis3l2. For each condition, n = 10 animals. Scale bars, 200 μm
