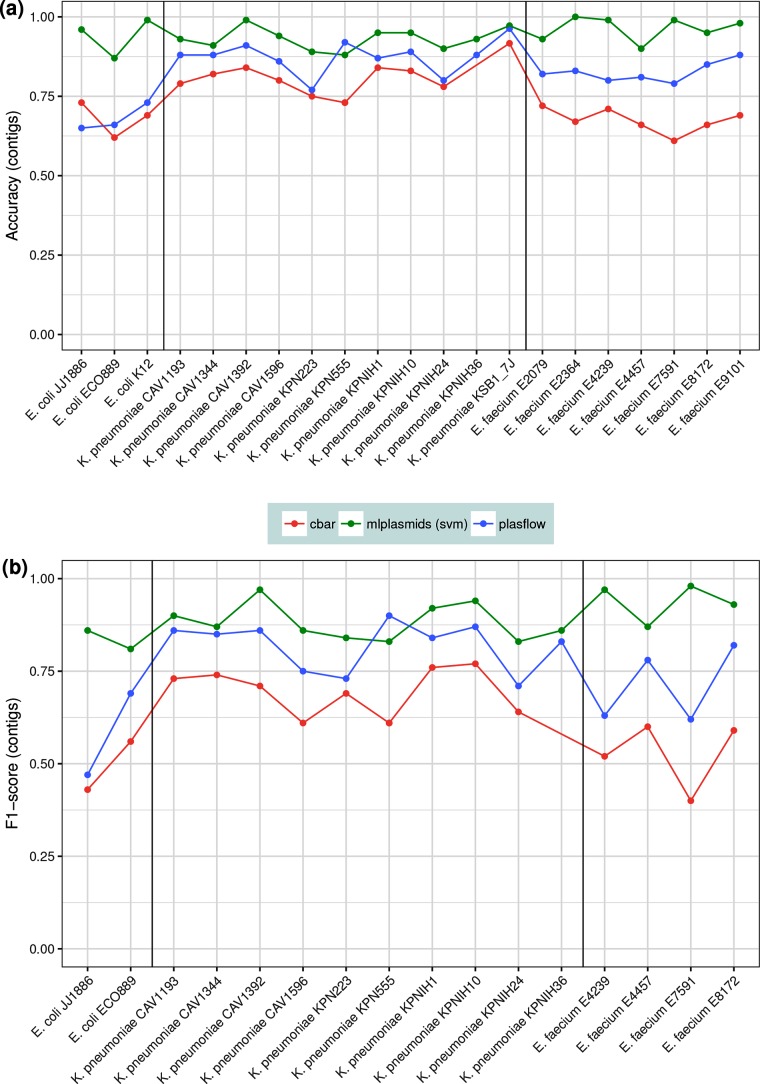
Fig. 4.
Benchmarking of cBAR (red), mlplasmids (green) and PlasFlow (blue) using an independent set of isolates (n=20). (a) Accuracy was measured in contigs and reported for all isolates including samples considered as negative controls (E. coli K. 12, K. pneumoniae KSB1_7J, E. faecium E2079, E. faecium E2364 and E. faecium E9101). (b) The F1-score was measured in contigs and only reported for isolates bearing plasmids (n=16).

