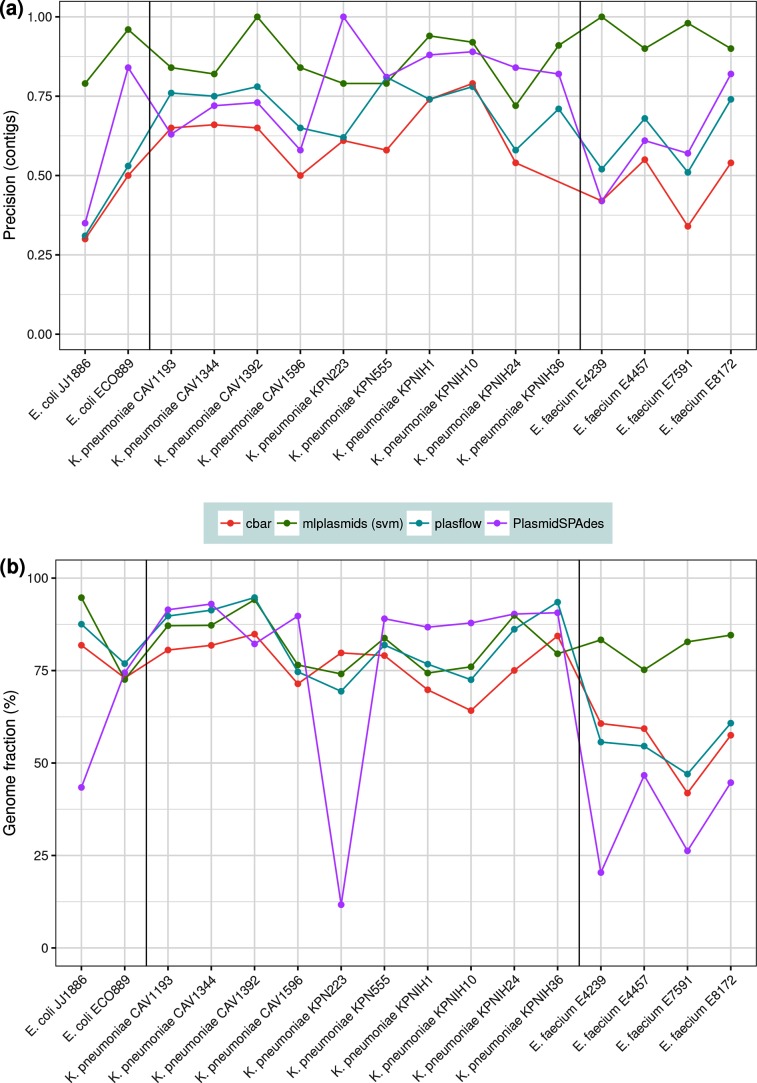
Fig. 5.
Comparison of cBAR (red), mlplasmids (green), PlasFlow (blue) and PlasmidSPAdes (purple) using an independent set of isolates. (a) Precision was measured in contigs and reported only for isolates bearing plasmids (n=16). (b) Genome fraction (measured as percentage of base pairs) was extracted from Quast analysis for isolates bearing plasmids (n=16).

