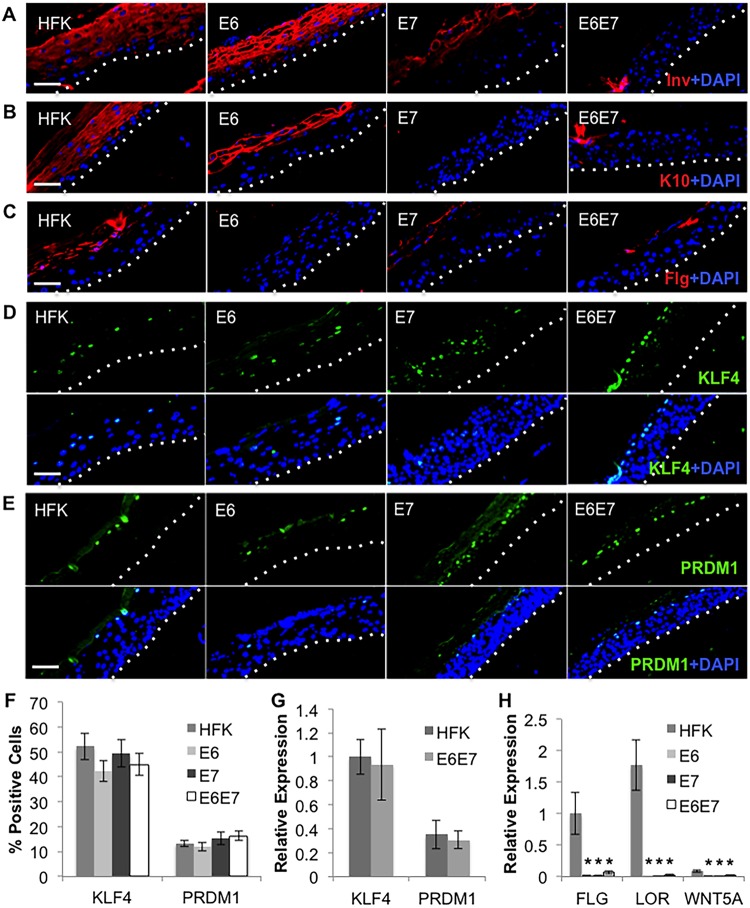
FIG 8.
Delayed differentiation in E7-expressing HFK rafts. (A to E) IF staining of involucrin (Inv) (A), cytokeratin 10 (K10) (B), filaggrin (Flg) (C), KLF4 (D), and PRDM1 (E) in parental HFK rafts and HFK rafts expressing E6 and/or E7. Basal layers are delineated by dotted lines. Scale bars represent 50 μm. (F) Percentages of KLF4- and PRDM1-positive cells were quantified as the percentages of total cells in rafts. Shown are the average values and standard errors of the means. (G) HFK and E6E7 rafts (n = 3) were analyzed by RT-qPCR for mRNA levels of KLF4 and PRDM1. KLF4 expression level in HFK was arbitrarily set to 1. (H) Rafts were analyzed by RT-qPCR for mRNA levels of FLG, LOR, and WNT5A. (G, H) Shown are the average relative expression levels and standard errors of the means from a minimum of three rafts per group. *, P < 0.05 relative to the results for parental HFK.

