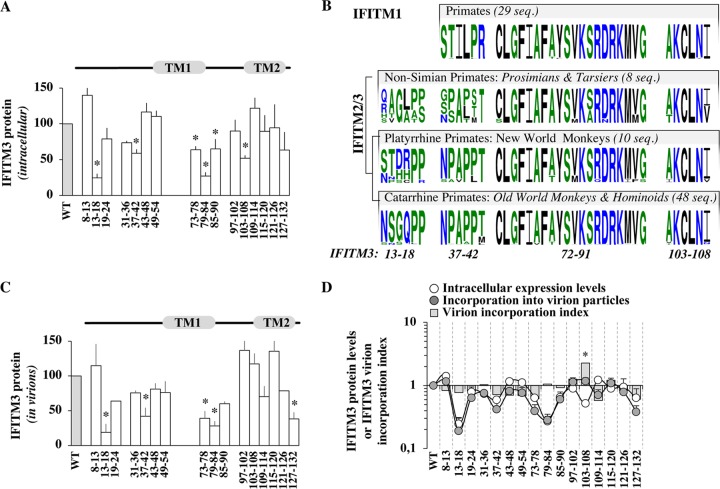
FIG 4.
Identification of conserved IFITM3 domains that influence the intracellular levels of accumulation of IFITM3 and modulate the extent of IFITM3 incorporation into virions. (A) Domains influencing the intracellular levels of accumulation of IFITM3. The amounts of IFITM3 mutants present in intracellular lysates were determined after WB analysis following densitometry-based quantification and normalization to WT values. (B) Evolutionary conservation of domains influencing IFITM3 levels. Shown are primate IFITM1, -2, and -3 with sequence logos showing amino acids (probability is plotted on the y axis) corresponding to the different domains of interest for each primate gene clade. The number of sequences used for the analysis is indicated (seq, sequences) (see Materials and Methods for details). Color-coding is the default in WebLogo3. (C) Domains influencing IFITM3 incorporation into virion particles (as in panel A), after quantification of the levels of IFITM3 mutants present in exo-RT-normalized virion particles. (D) Comparison between the intracellular levels of expression and virion incorporation of the different IFITM3 mutants (log scale) following densitometry-based quantification and normalization to WT values. The graph also displays the ratio of the amount of IFITM3 protein incorporated into virion particles with respect to their intracellular levels of expression as a virion incorporation index, after normalization to WT IFITM3. *, P < 0.05 as determined by a Student t test for comparison between the indicated mutant and the WT (two tailed, unpaired).

