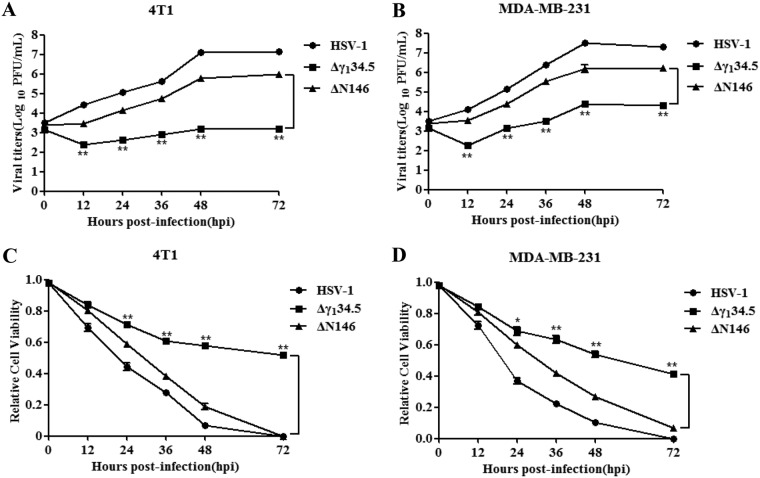
FIG 2.
(A and B) Kinetics of viral growth in 4T1 (A) and MDA-MB-231 (B) cells. Cells were infected with indicated viruses (0.01 PFU/cell). Viral yields were measured at different time points postinfection. (C and D) Viral cytolytic effects on 4T1 (C) and MDA-MB-231 (D) cells. Cells were infected with viruses (0.1 PFU/cell) for 2 h, and then cell viability was determined by CellTiter-Glo luminescent cell viability assay at the indicated times. The relative cell viability is normalized to that of the mock control. All the data are representative of those from three experiments with triplicate samples. Differences between the selected groups were statistically assessed by a two-tailed Student t test. *, P < 0.05; **, P < 0.01.

