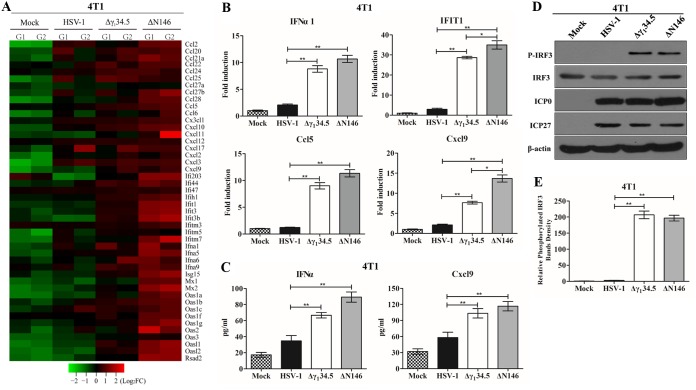
FIG 4.
(A) Transcriptome analysis of 4T1 cells. Cells were mock infected or infected with the indicated viruses (5 PFU/cell). At 6 h postinfection, samples were processed for microarray analysis. The heat map includes 46 chemokines or interferon-related genes (IRGs). G1 and G2 represent distinct experimental replicates. The data represents log2 fold changes. (B) Expression of IFN-α1, IFIT1, Ccl5, and Cxcl9. The RNA samples were analyzed by quantitative PCR. Results are expressed as fold activation with SDs among triplicate samples. Differences between the selected groups were statistically assessed by a two-tailed Student t test. (C) 4T1 cells were mock infected or infected with HSV-1(F), Δγ134.5, or ΔN146 (5 PFU/cell) for 16 h. Cell supernatants were collected to determine IFN-α and Cxcl9 levels using a commercial ELISA kit. The data from triplicate samples were statistically assessed by a two-tailed Student test. (D) IRF3 phosphorylation detection after HSV-1(F), Δγ134.5, or ΔN146 infection. 4T1 cells were infected with the indicated viruses at 5 PFU/cell, and cell lysates were subjected to immunoblotting analysis with antibodies against IRF3, phosphorylated IRF3 (Ser396), ICP27, ICP0, and β-actin at 6 h postinfection. (E) Quantification of IRF3 phosphorylation. The protein bands shown in panel D were quantified using NIH ImageJ software. The data are presented as the relative amount of phosphorylated IRF3 normalized to the total level of IRF3 in each sample, with mock infection arbitrarily set at 1.0. The data are averages from three independent experiments and were statistically assessed by a two-tailed Student t test. *, P < 0.05; **, P < 0.01.

