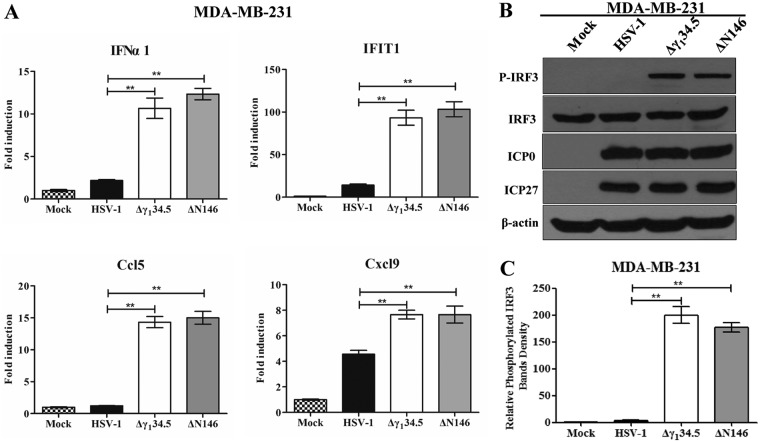
FIG 5.
(A) Cytokine expression in MDA-MB-231 cells. Cells were either mock infected or infected with HSV-1(F), Δγ134.5, or ΔN146 (5 PFU/cell). At 6 h after infection, total RNA extracted from cells was subjected to quantitative real-time PCR amplification for the expression of IFN-α1, IFIT1, Ccl5, and Cxcl9 on MDA-MB-231 cells. The results are representative of those from three experiments with triplicate samples and were statistically assessed by a two-tailed Student t test. (B) IRF3 phosphorylation viral infection. MDA-MB-231 cells were infected with the indicated viruses at 5 PFU/cell, and cell lysates were subjected to immunoblotting analysis with antibodies against IRF3, phosphorylated IRF3 (Ser396), ICP27, ICP0, and β-actin at 6 h postinfection. (C) Quantification of IRF3 phosphorylation. The protein bands shown in panel B were quantified using NIH ImageJ software. The data are averages from three independent experiments and were statistically assessed by a two-tailed Student t test. **, P < 0.01.

