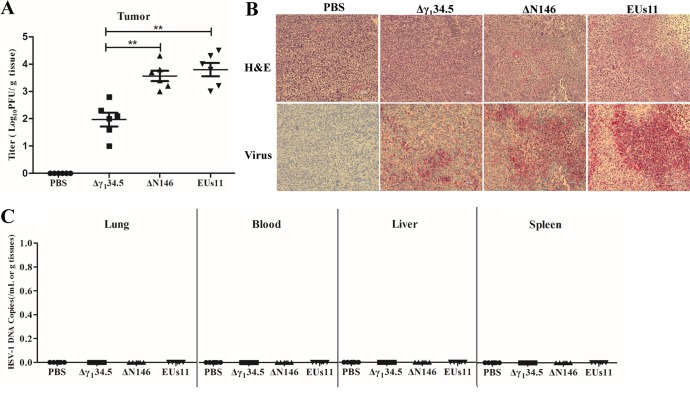
FIG 8.
(A) Viral growth in 4T1 tumors. Tumors treated with PBS, Δγ134.5, ΔN146, and EUs11 suspended in PBS were collected on day 9, and infectious viruses present in tumors were quantified by plaque assay (n = 6). (B) Hematoxylin and eosin (H&E) and immunostaining showing the HSV-1 antigens in the tumors. (C) Quantification PCR analysis of HSV-1 DNA in blood, liver, and spleen (n = 6). All the data are representative of those from three experiments. Differences between the selected groups were statistically assessed by a two-tailed Student t test. **, P < 0.01.

