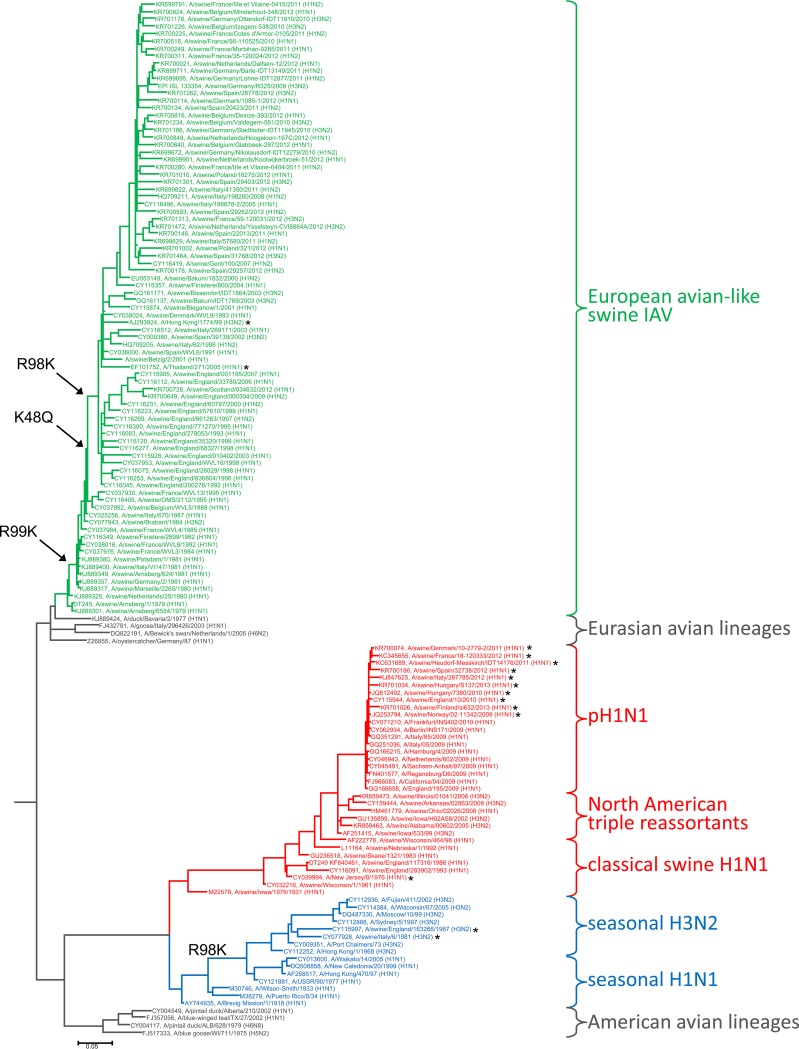
FIG 4.
Phylogenetic analysis of representative NP sequences and the presence of MxA resistance-enhancing mutations. Shown is a maximum-likelihood tree of 140 aligned representative NP sequences. Nucleotide sequences were retrieved from GenBank, manually aligned, and used for Bayesian tree inference with MrBayes, v3.2. The GTR+G+I substitution model was used. Convergence was reached after 3 million generations. The bar indicates substitutions per site. Avian sequences are printed in gray, human seasonal sequences (H1N1, H3N2) in blue, Eurasian porcine sequences in green, and the classical swine-derived H1N1 sequences in red. Amino acid substitutions resulting in MxA resistance are indicated. The complete phylogenetic tree is shown in Fig. S2 in the supplemental material. Zoonotic events are highlighted with asterisks.

