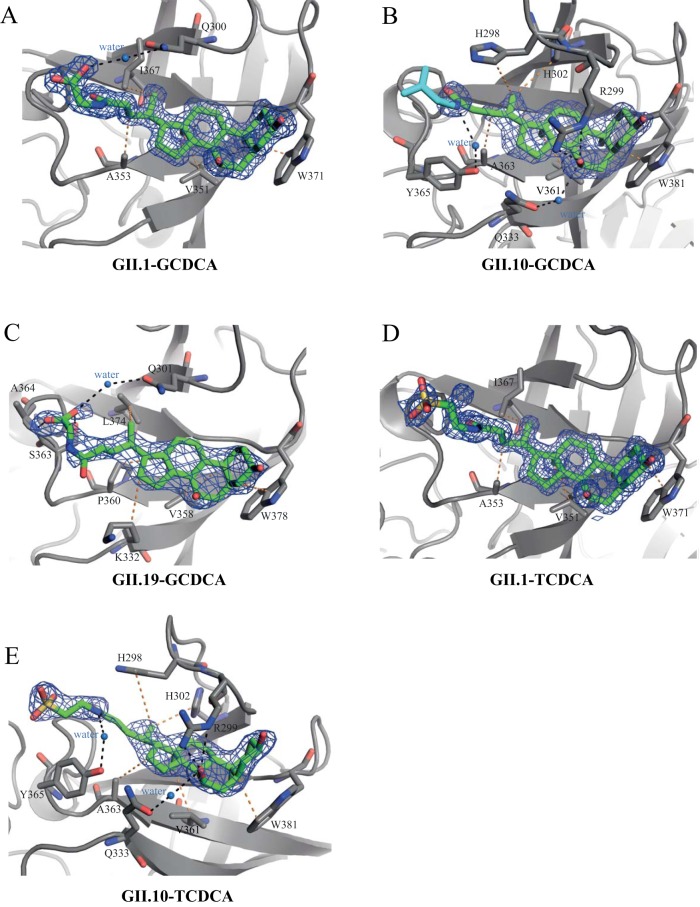
FIG 4.
Closeup view of the bile acid binding pockets. The P domains are colored as chain A (dark gray) and chain B (light gray). The omit map (2Fo − Fc) (blue mesh) is contoured between 2.5 and 2.0 σ. Black dashed lines show the hydrogen bond interactions, while orange lines show hydrophobic interactions. Water molecules are shown as marine-blue spheres. The hydrogen bonds and hydrophobic interactions are given between 2.5 and 3.5 Å and between 3.9 and 5.3 Å, respectively. (A) GII.1 and GCDCA complex; (B) GII.10 and GCDCA complex; (C) GII.10 and GCDCA complex; (D) GII.1 and TCDCA complex; (E) GII.10 and TCDCA complex.

