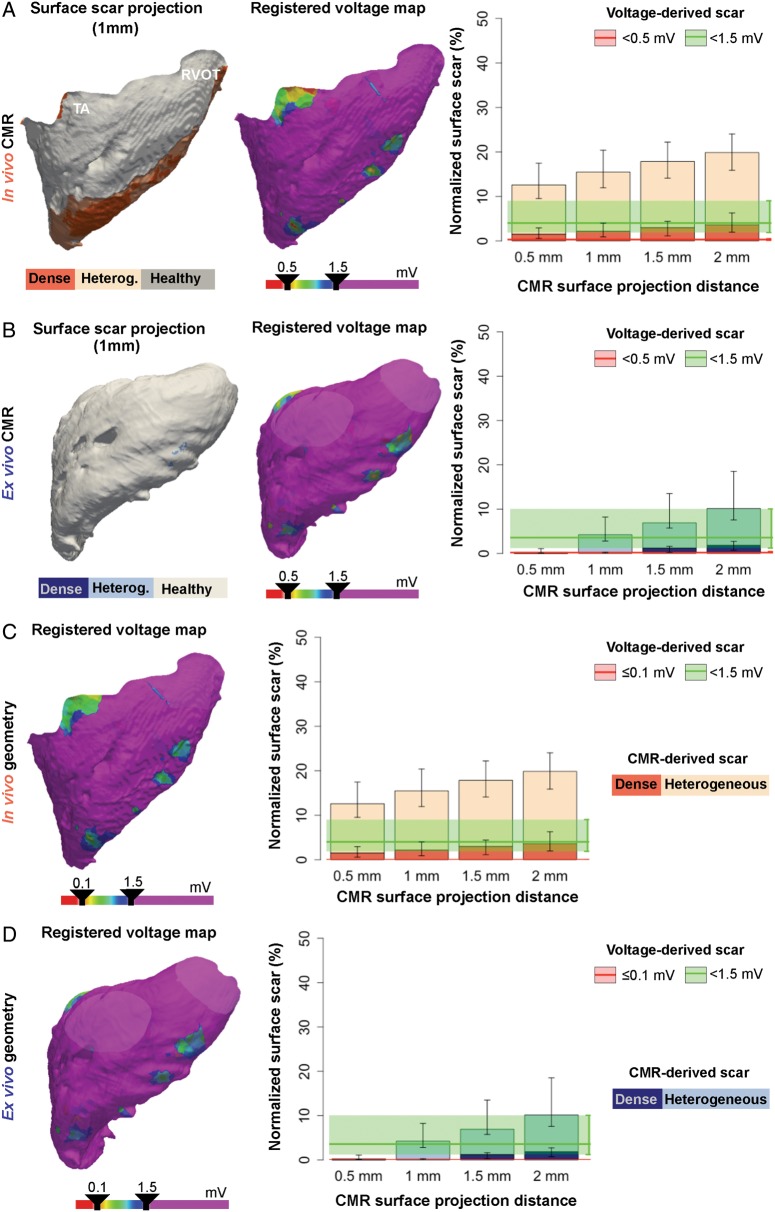
Figure 5.
Right ventricular scar comparisons between registered voltage maps and CMR images. (A, B, left panel) Representative case of surface scar projections from in vivo (A) and ex vivo (B) CMR images, and registered voltage maps (mid-panel) using a very low voltage cut-off <0.5 mV onto the right ventricular geometries. On the right, surface scar projections of dense and heterogeneous scars at different projection distances from the endocardial border of in vivo (A) and ex vivo (B) CMR images. The median (red and green lines) and interquartile range (red and green shadows) of registered very low and low voltage-derived scars (<0.5 mV and <1.5 mV, respectively) are also represented. (C, D, left panel) Same representative registered voltage maps as in A (in vivo geometry), B (ex vivo geometry), using a very low voltage cut-off ≤0.1 mV. On the right, same data as in A, B using the ≤0.1 mV cut-off criterion for very low voltage-derived scars. Right panels show data from the entire group of animals (n = 10). CMR, cardiac magnetic resonance; RVOT, right ventricular outflow tract; TA, tricuspid annulus.

