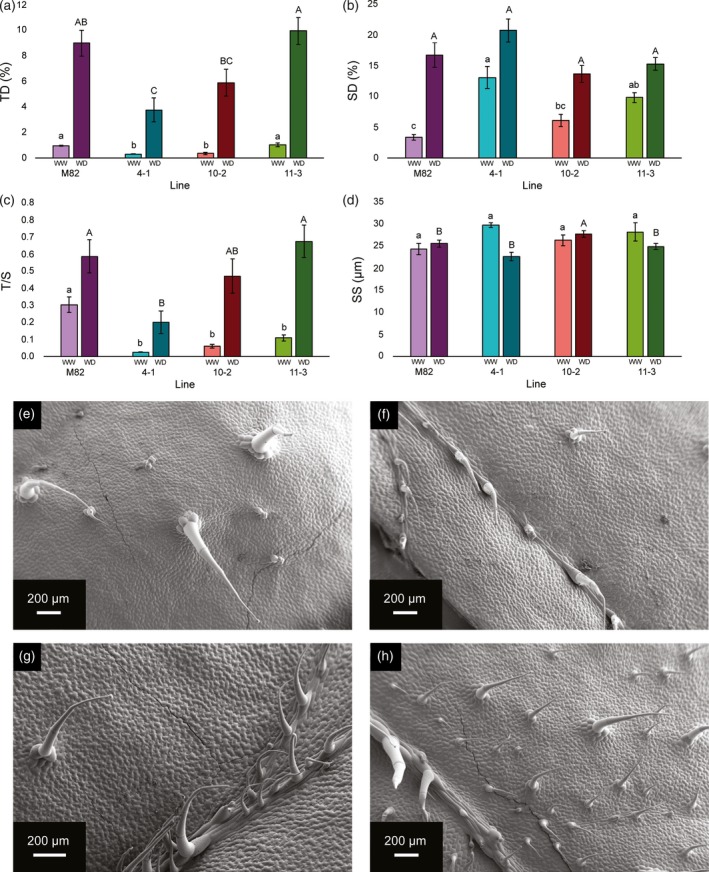
Figure 1.

Initial morphological characterization of lines M82, 4‐1, 10‐2 and 11‐3 grown under glasshouse (GH) and field (F) conditions before the onset of drought treatment. (a) Trichome density (TD), (b) stomatal density (SD), (c) trichome‐to‐stomata ratio (T/S) and (d) stomatal size (SS) are expressed as mean ± SE of between three and six replicates per line and treatment. TD and SD were calculated as a percentage of the total number of epidermal cells. SS was calculated as pore length. Different letters denote statistically significant differences by Tukey's analysis (P < 0.05) within glasshouse‐grown plants (lower case) and field‐grown plants (upper case). For panels (a)–(d), purple bars represent M82, turquoise represents 4‐1, red represents 10‐2 and green represents 11‐3, with lighter and darker shades representing GH and F conditions, respectively. Representative scanning electron micrographs for each line: (e) M82, (f) 4‐1, (g) 10‐2 and (h) 11‐3.
