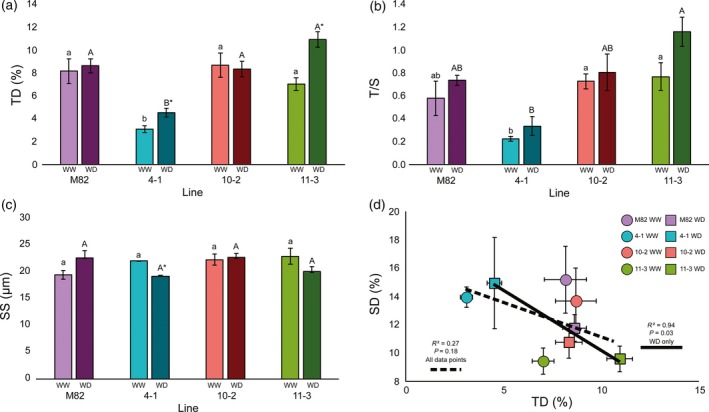
Figure 2.

Characterization of epidermal features in lines M82, 4‐1, 10‐2 and 11‐3 under water‐deficit (WD) and well‐watered (WW) conditions in the field. (a) Trichome density (TD) is expressed as a percentage of the number of trichomes per epidermal cell. (b) Trichome‐to‐stomata ratio (T/S) is expressed as the total number of trichomes divided by the total number of stomata in a given area. (c) Stomatal size (SS) is expressed as pore length. Different letters denote statistically significant differences identified by Tukey's analysis (P < 0.05) within WW plants (lower case) and WD plants (upper case). Asterisks represent significant differences for each line between treatments according to the Tukey's test (P < 0.05). (d) A correlation between TD and SD was observed only under WD conditions, according to Pearson's test (P < 0.05), with the correlation index shown in the graph. For panels (a)–(c), purple bars represent M82, turquoise represents 4‐1, red represents 10‐2 and green represents 11‐3, with light and dark colours representing WW and WD treatments, respectively. In panel (d), squares represent WD values and circles represent WW values, and are colour coded as in panels (a)–(c). The dashed line represents the regression line for all data points (P > 0.05) and the solid line represents the regression line for WD data points (P = 0.03). Values are means ± SEs (n = 3).
