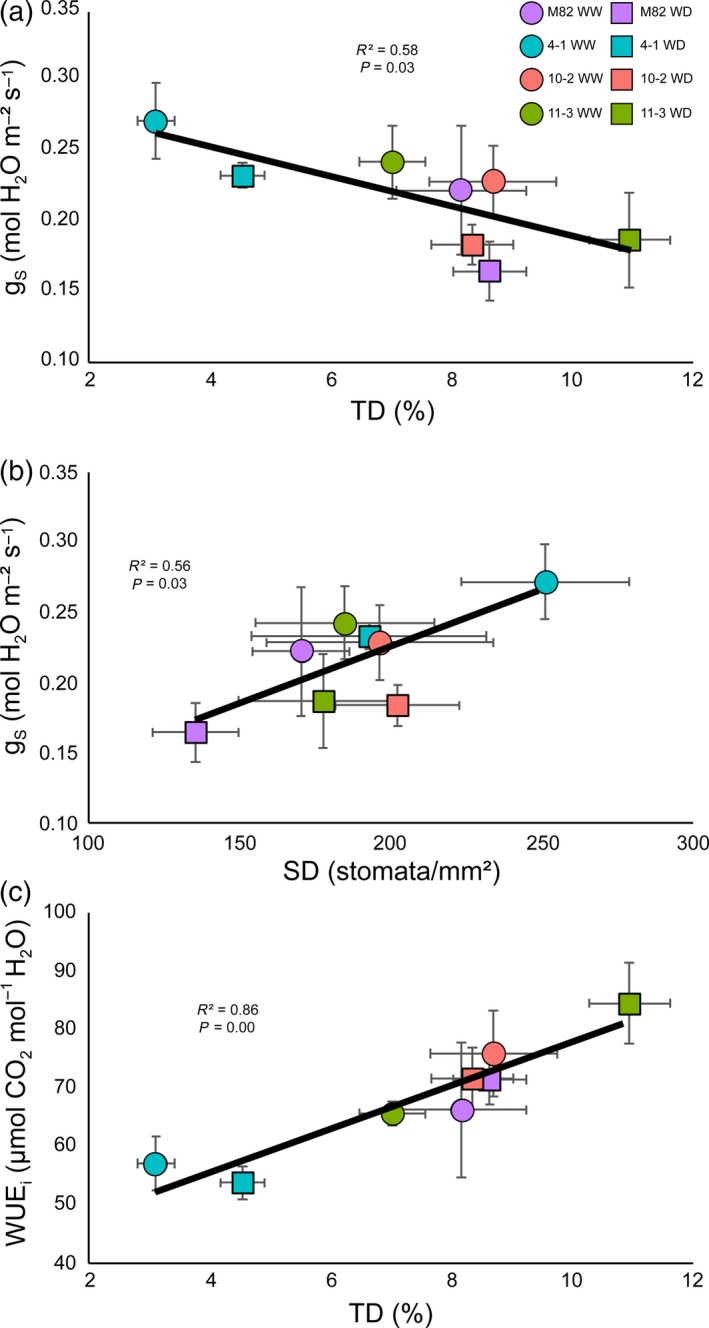
Figure 3.

Relationships between trichome and stomatal densities and photosynthetic parameters in lines M82, 4‐1, 10‐2 and 11‐3: (a) inverse correlation between trichome density and stomatal conductance (g s); (b) positive association between stomatal density and stomatal conductance (g s); and (c) positive association between trichome density and intrinsic water use efficiency (WUE i). Correlation coefficients and P values calculated by Pearson's test are displayed in each graph. Purple markers represent M82, turquoise markers represent 4‐1, red markers represent 10‐2 and green markers represent 11‐3. Circles represent values under well‐watered (WW) conditions in the field and squares represent values under water‐deficit (WD) conditions in the field. Values are means ± SEs (n = 3–4).
