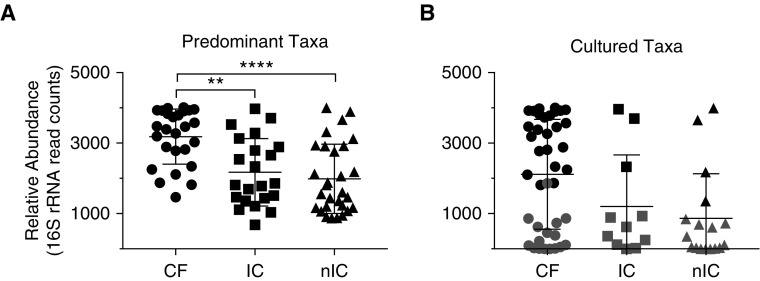
Figure 1.
(A) Relative abundance, in operational taxonomic unit (OTU) read counts, of the most abundant taxon in each sample. The relative abundance of predominant cystic fibrosis (CF) OTUs was significantly higher than those of immunocompromised (IC) and nonimmunocompromised (nIC) samples following Kruskal-Wallis testing with Dunn’s multiple comparisons test. (B) Relative abundance of taxa that were isolated in the clinical laboratory. Solid points correspond to the most abundant taxa. Shaded points are nonpredominant taxa that were cultured. All samples were rarefied to 4,025 counts. **P = 0.0023, ****P < 0.0001.

