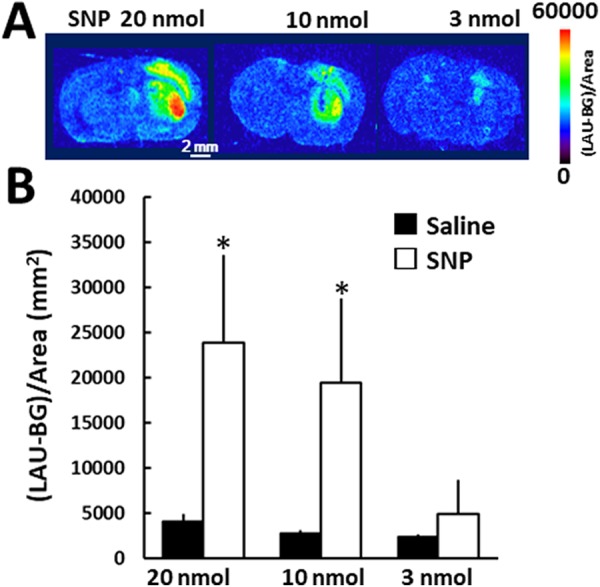
Figure 1.

Fluorescence accumulation in the SNP-injected mouse brain. A, Sodium nitroprusside was injected into the striatum on the right side of the image, and saline was simultaneously injected into the contralateral striatum. Dihydroethidium was administered through the tail vein 60 minutes after the SNP injection. Bar = 2 mm. B, Quantitative analysis of the fluorescence images. The ROIs were identified based on highly fluorescent areas of the SNP-injected striatum and the contralateral area. Mean (standard deviation), n = 4-5. *denotes P < .05, between the saline- and the SNP-injected side using the Student paired t test. ROIs indicates regions of interest; SNP, sodium nitroprusside.
