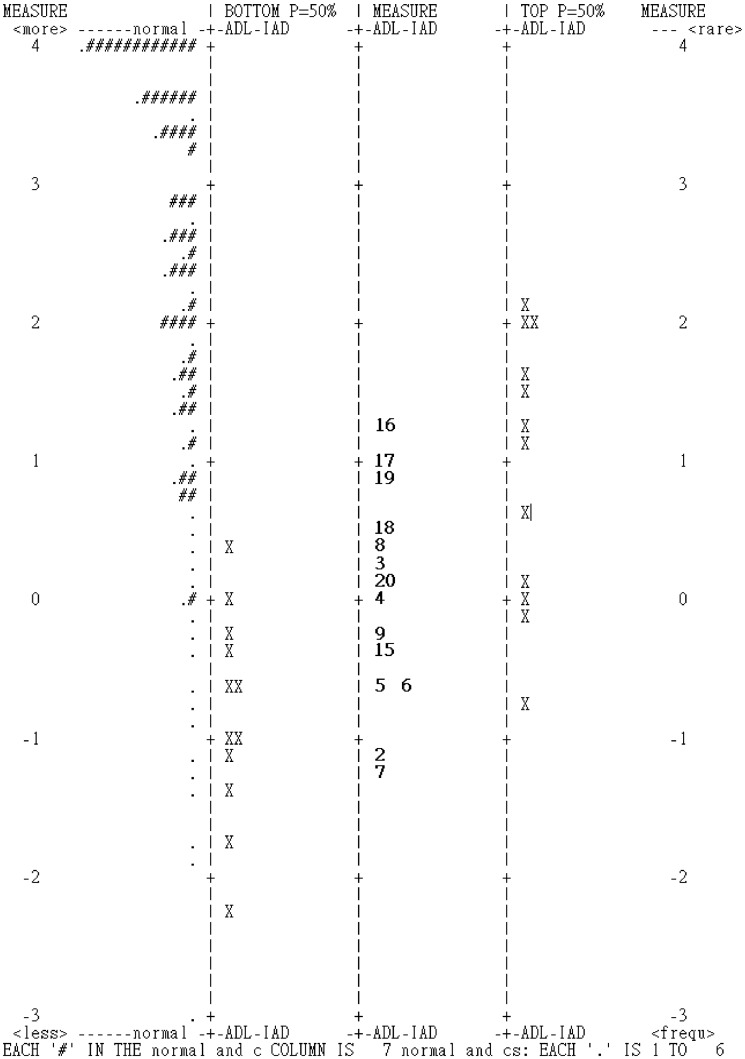
Figure 1.
Item-person map of sf-ADLS.
Note: The vertical line represents the measure of difficulty, with logit values given on two sides. The item difficulty levels perceived by a person are represented as ‘X’ symbols and aligned to the left of the corresponding measure. Items are aligned on the middle of the corresponding values. The accumulation of patients in the uppermost area of the scale indicates a ‘ceiling’ effect.

