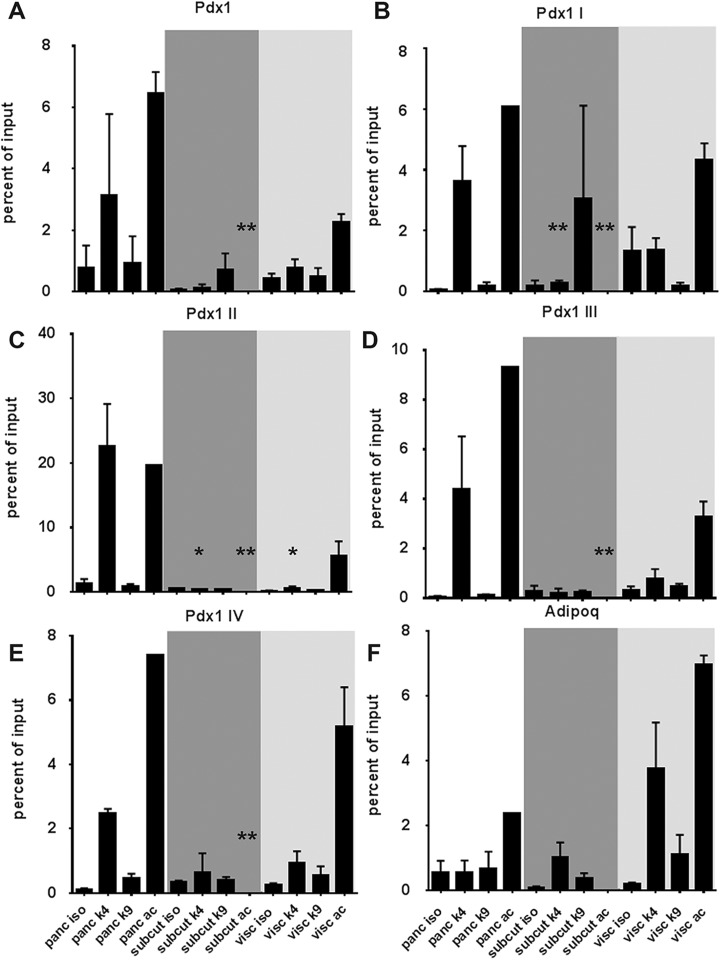
Fig 2.
Validation of ChIP sequencing using quantitative real-time PCR. Ct values for isotype (control), H3K4 trimethylation (me3), H3K9 trimethylation (me3) and H3 ac pulldown were normalized to input DNA and presented as percent of input for the Pdx1 promoter region (A) as well as upstream regions I–IV (B–E) of the Pdx1 gene, which are recognized to be the pre-patterning modifications for pancreatic cell fate (Xu et al.27). Adipose-specific epigenetic modifications were assessed at the adiponectin (Adipoq) gene promoter region. Data presented as mean and SD from at least N=5 or 6 tissues in each group. Shaded background regions indicate pancreatic (white backdrop), subcutaneous adipose tissue (dark grey backdrop) and visceral adipose (light grey backdrop) tissue samples. Significant differences are represented by a *(p<0.05) or **(p<0.01) as compared with the respective pancreatic tissue modification (K4, K9 or ac).
ChIP: chromatin immunoprecipitation; Ct: cycle threshold; PCR: polymerase chain reaction; SD: standard deviation.

