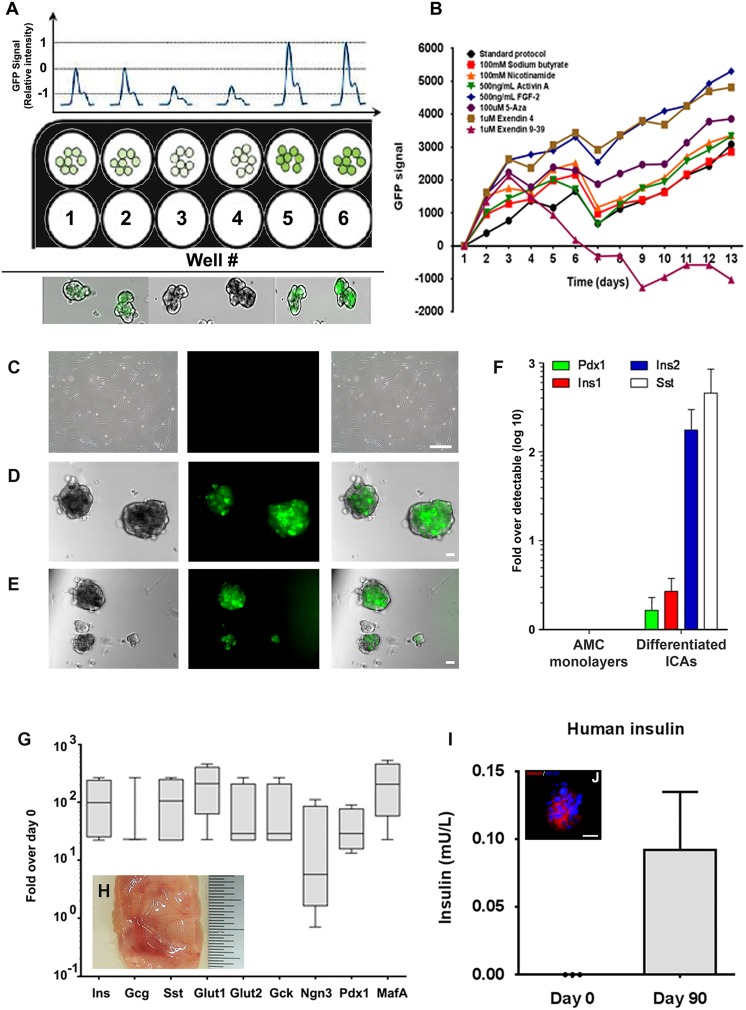
Fig 5.
Differentiation and function of AMCs. (A) Visceral adipose-derived AMCs from Pdx1-GFP mice were exposed to various growth and differentiation factors. Panel (A) represents the experimental setup where GFP reporter (Pdx1-GFP) AMCs were plated in (black) 96-well plates and fluorescent intensities recorded as detailed in methods. Note that some (minimal) level of GFP seen in the cells (wells 1 and 2), represented as ‘0’ intensity, diminished when exposed to the GLP1 antagonist (exendin 9-39; wells 3 and 4) or to increase in intensity when exposed to an agonist (wells 5 and 6). All conditions were set up in triplicate. (B) Cultures were stimulated to differentiate in the presence of the small molecules described in Supplementary Table 2 and the intensity of GFP fluorescence was measured at the same time of the day and at regular (24 h) intervals. Data were corrected with respect to the blank (well containing media but no cells) and presented relative to the GFP signal measured on day 1. Values generated for day 1 are therefore presented as ‘0’ fluorescence, while subsequent measurements are presented relative to day 1. AMCs generated from Pdx1-GFP transgenic mice do not show GFP expression as monolayers (C). However, when stimulated to differentiate into an endocrine pancreatic lineage, AMCs formed multiple, small ICAs that express GFP in presence of exendin-4 (D) or FGF2 (E). Bar = 20μm. GFP-expressing ICAs were analyzed using TaqMan-based quantitative PCR for the expression of endocrine pancreatic gene transcripts. Data are presented as fold difference over the detectable Ct value was calculated using the ΔΔCt method (Hardikar A et al.29) (F). Human AMCs were induced to differentiate into endocrine pancreatic lineage using FGF2 and exendin-4 agonist and transplanted in NOD/SCID mice using TheraCyte™ devices. Human AMC-derived ICAs showed detectable expression of pro-endocrine gene transcripts (G). Box and whisker plot showing the abundance of transcript at day 90 relative to expression in day 0 (undifferentiated) AMCs. The line in the box represents the median and the box represents the upper and lower quartile (N=4 mice). ICA-containing TheraCytes™ showed evidence of vascularization (H), showed detectable levels of human insulin (mean ± SD; N=3) in mouse circulation (I) and contained insulin-producing cells after 90 days of in-vivo studies (J); red: insulin, blue: DAPI: nuclei; bar = 20μm.
AMC: adipose tissue-derived mesenchymal cell; ICA: islet-like cell aggregate; AMC: Adipose-derived mesenchymal cells; ICAs: Islet-like Cell Aggregates; Pdx1: Pancreatic and duodenal homeobox 1; GLP1: Glucagon-like Peptide 1; GFP: Green Fluoroscence Protein; FGF2: Fibroblast Growth Factor 2; PCR: Polymerase Chain Reaction; Ct: Cycle threshold; NOD/SCID: Non-obese Diabetic/Severe Combined Immunodeficiency; DAPI: 4′,6-diamidino-2-phenylindole; SD: Standard Deviation.

