
Figure 2.
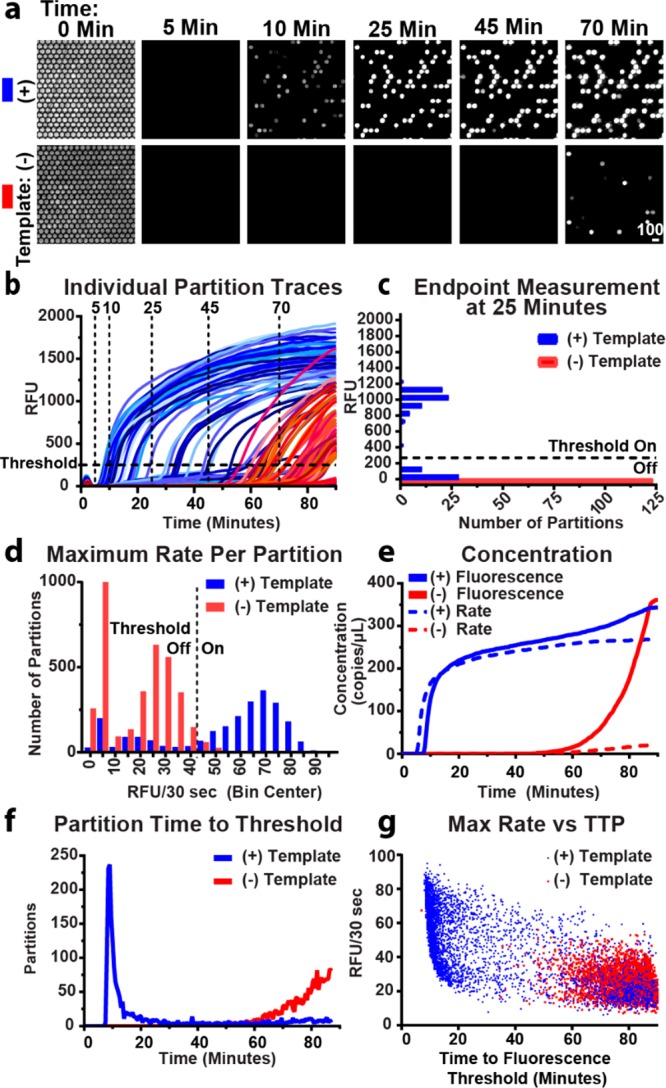
Experimental demonstration of the real-time digital LAMP (dLAMP) approach using the commercially available enzyme Bst 3.0. Experiments were run at 70 °C and imaged using a commercial microscope. (a) A time course of fluorescence images from a subset of 350 partitions out of 20000 partitions undergoing dLAMP reactions (intensity range 920–1705 RFU). (b) Fluorescence intensity for a subset of partitions over time. Blue traces indicate partitions containing template; red traces indicate fluorescence in the absence of template (i.e., nonspecific amplification). Partitions turn “on” at the time point when the curve passes the threshold at 250 RFU. Vertical traces correspond to time points illustrated in (a) and generate end-point measurements. (c) An “end-point” measurement taken on a subset of partitions at 25 min. Bin width is 100 RFU. Fluorescence threshold is 250 RFU. (d) A histogram of the maximum observed change in fluorescence of individual partitions using the full chip. Rate threshold is 45 RFU/30 s. (e) Change in observed bulk concentration over time from the full chip using fluorescence intensity as threshold (solid lines) and rate (dashed lines). (f) Time at which individual partitions in (b) cross the fluorescence intensity threshold. (g) Maximum rate per partition plotted by time to fluorescence intensity threshold.