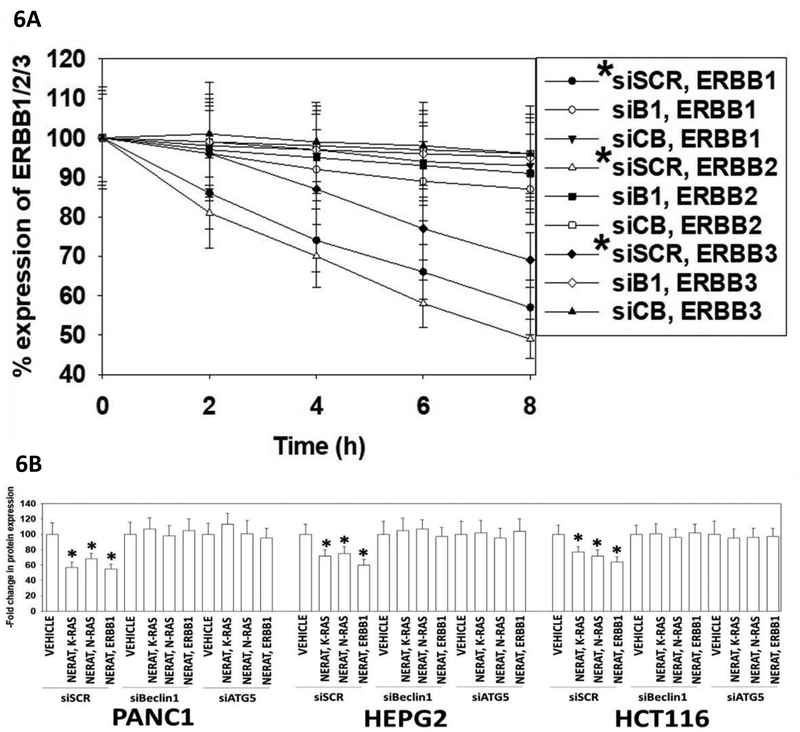
Figure 6. Neratinib down-regulates the expression of ERBB1, K-RAS and N-RAS via autophagy.
A. HCT116 colorectal tumor cells were transfected with a scrambled siRNA, with an siRNA to knock down the autophagy regulatory protein Beclin1 (B1), or with an siRNA to knock down the lysosomal protease cathepsin B (CB). After 24h, the expression of Beclin1 or of cathepsin B had been reduced by >75% compared to scrambled control. Twenty-four h after transfection, cells were treated with vehicle control or with neratinib (50 nM) for 0–8h. Vehicle control exposure did not alter receptor basal expression. Cells were fixed in place at the indicated time points and immunofluorescence staining performed to determine the total expression of ERBB1, ERBB2, ERBB3. Cells were visualized in the Hermes WiScan instrument at 10X magnification. The intensity of 40 cells per condition was determined using the machine’s own software combined with data from another two wells of separately treated cells, and with background fluorescence subtracted. Secondary antibody alone staining did not generate any signal (* p < 0.05 less than vehicle control; the data are the mean fluorescence from 120 data points from three separate drug exposures +/− SEM). B. PANC1 (mut. K-RAS), HEPG2 (mut. N-RAS) and HCT116 (mut. K-RAS) cells were transfected with a scrambled siRNA control molecule or siRNA molecules to knock down the expression of Beclin1 or ATG5. Twenty-four h after transfection cells were treated with vehicle control or neratinib (50 nM) for 6h. Cells were fixed in place at the indicated time points and immuno-fluorescence staining performed to determine the total expression of ERBB1, K-RAS & N-RAS. Cells were visualized in the Hermes WiScan instrument at 10X magnification. The staining intensity of 40 cells per condition was determined using the machine’s own software combined with data from another two wells of separately treated cells, and with background fluorescence subtracted. Secondary antibody alone staining did not generate any signal (* p < 0.05 less than vehicle control; the data are the mean fluorescence from 120 data points from three separate drug exposures +/− SEM).

