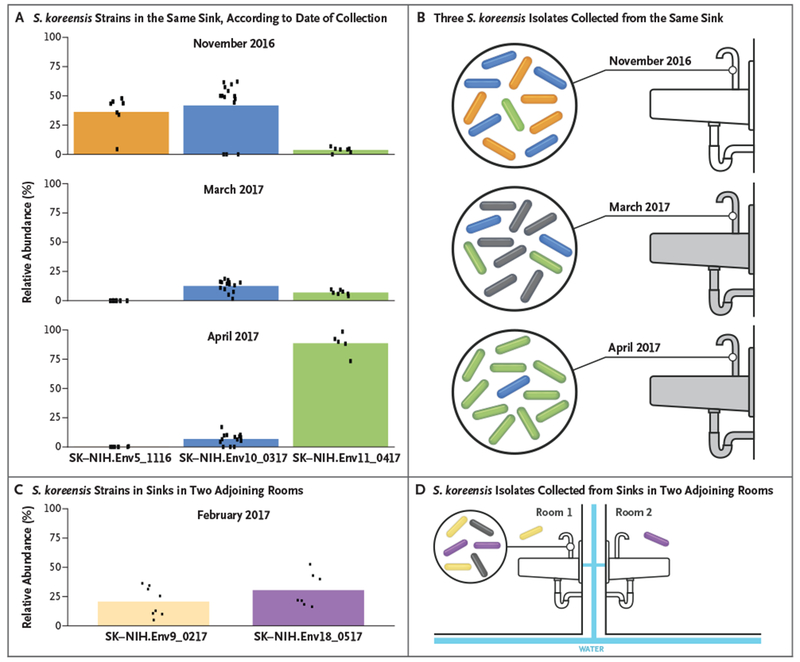
Figure 4. Metagenomic Sequencing of Multiple S. koreensis Strains Cultured from Sinks in Patient Rooms at the NIH Clinical Center.

Panels A and B show the relative abundance of three S. koreensis strains (SK-NIH.Env5_1116, SK-NIH.Env10_0317, and SK-NIH. Env11_0417) collected from the same sink in one patient room in November 2016, March 2017, and April 2017. The relative abundance of each isolate is represented by the colored bars in Panel A. Relative abundance was estimated by calculation of the mean allele frequency of SNVs that were unique to each isolate (dots). The sink was replaced after the first positive sample was obtained in November 2016 (indicated by the gray sink in Panel B), but S. koreensis was cultured again from this sink in March 2017 and in April 2017. The colored rods in Panel B correspond to the three isolates in Panel A. Panels C and D show the relative abundance of two other S. koreensis strains (SK-NIH.Env9_0217 and SK-NIH.Env18_0517) that were detected in the sinks of two adjoining patient rooms. The colored rods in Panel D correspond to the two isolates in Panel C. The rods that appear outside the circle indicate individually cultured isolates. The gray rods in Panels B and D represent isolates with unknown SNV profiles. The water in the two rooms in Panel D was supplied by the same pipes (blue bars).
