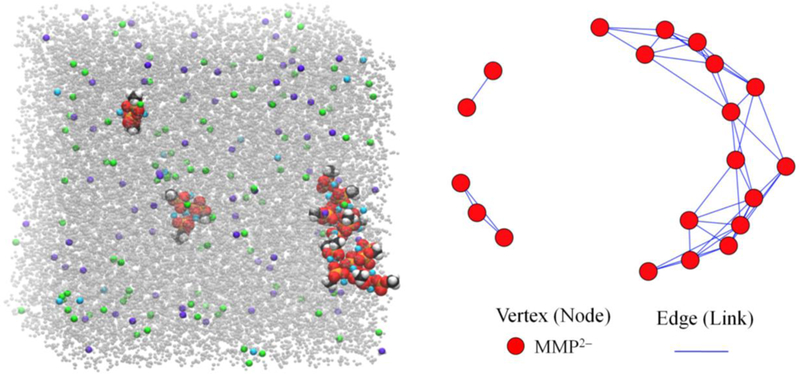
Figure 3.

The 400 ns snapshot (left) and its graph representation (right) from simulation S5a (K+ and Ca2+ generated with the C36 force field with adjusted calcium LJ parameters (NBFIX). MMP2– molecules are approximately doubled in size for better visibility in the left panel, and coloring is the same as in Figure 1; water is gray, Ca2+ is cyan, K+ is violet, and Cl– is green. The graph consists of MMP2– as vertices (red) and edges between them (solid lines).
