
Figure 4.
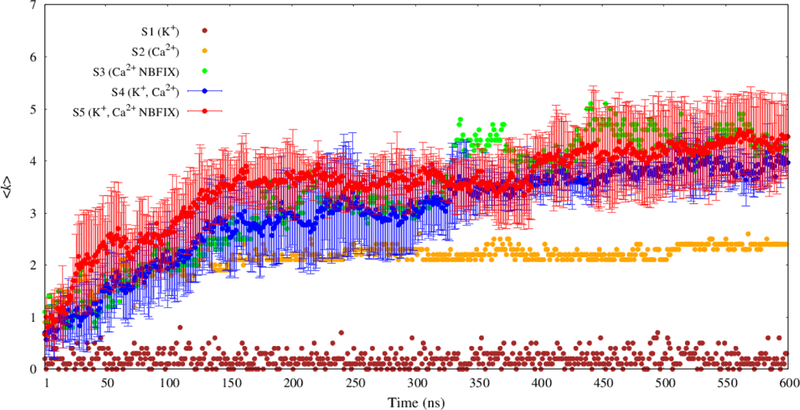
Time evolution of average vertex degree 〈k〉 for MMP2– graphs. The results of three replicates for each parameter set for the mixed system (S4 and S5) are presented as means (filled circles) with standard deviations (error bars).
Official websites use .gov
A
.gov website belongs to an official
government organization in the United States.
Secure .gov websites use HTTPS
A lock (
) or https:// means you've safely
connected to the .gov website. Share sensitive
information only on official, secure websites.
Time evolution of average vertex degree 〈k〉 for MMP2– graphs. The results of three replicates for each parameter set for the mixed system (S4 and S5) are presented as means (filled circles) with standard deviations (error bars).