
Figure 6.
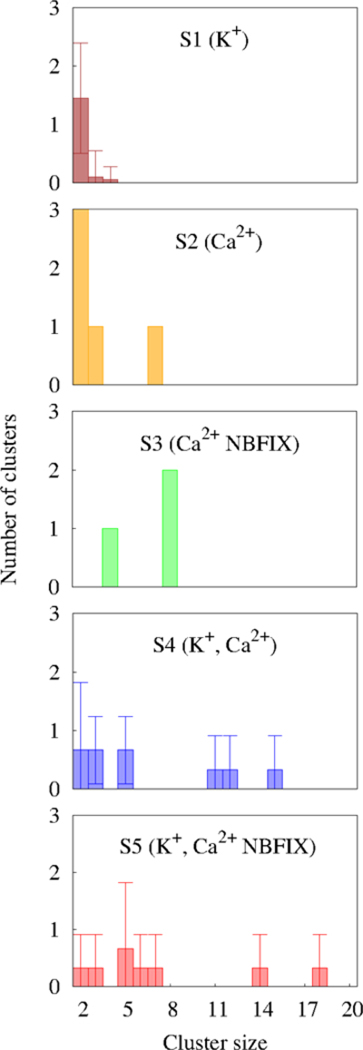
Cluster size distributions. The result of the system with only K+ was obtained by taking the averages over the last 20 ns trajectories (580–600 ns) since the clusters in this system were very short-lived (see Fig. 8); otherwise the 600 ns time point is represented. The error bars for S1 denote standard deviation over time (20 ns simulations). The results of two cation systems for each parameter set (S4 and S5) are presented as means and standard deviations.